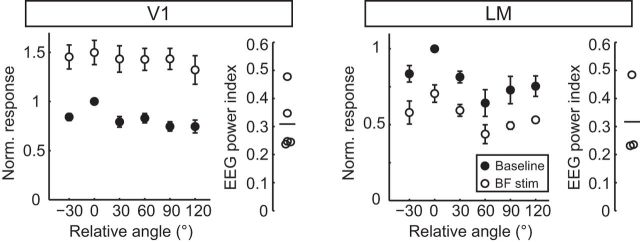
Figure 8.
LM and V1 neurons are differentially modulated by BF stimulation. Shown are average orientation tuning curves aligned to their peak response during baseline (filled circles) and BF stimulation (open circles) for PV neurons in V1 (n = 8 neurons, 5 mice) and LM (n = 6 neurons, 3 mice). Data are mean ± SEM.

