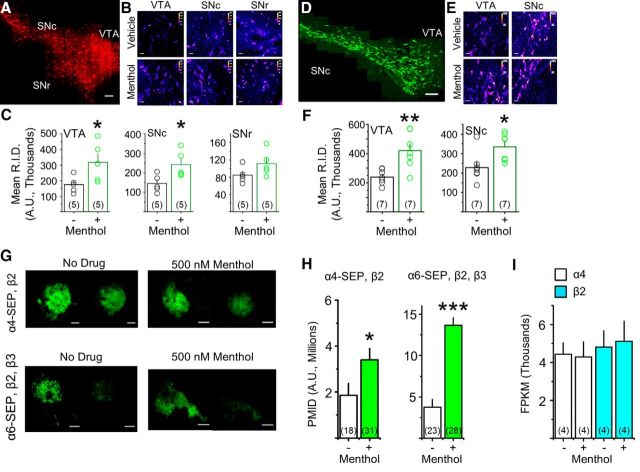
Figure 1.
Chronic menthol alone upregulates α4* and α6* nAChRs in vivo. A, Montage of 60× images from a vehicle-treated α4-mCherry mouse. Scale bar, 100 μm. B, 60× images of α4-mCherry direct fluorescence in the VTA, SNc, and SNr of mice treated with vehicle or menthol (2 mg/kg/h, 10 d). Scale bars, 10 μm. D, Montage of 60× images from a vehicle-treated α6-GFP mouse. Scale bar, 100 μm. E, 60× images of α6-GFP direct fluorescence in the VTA and SNc of mice treated with vehicle or menthol. Scale bars, 10 μm. B, E, Display lookup table “fire” was used in ImageJ. C, F, Quantification of α4-mCherry and α6-GFP intensities; transparent circles are mean intensities of individual mice. G, Representative TIRFM images of Neuro-2a cells transfected with α4-SEP and β2 nAChR subunits or with α6-SEP, β2, and β3 nAChR subunits. Menthol (500 nm) was added 24 h before imaging. Scale bars, 10 μm. In each panel, the left image is at pH 7.4 and the right image is the same cell at pH 5.4. H, PMID was quantified for SEP nAChRs. I, RNA transcript levels of α4 and β2 nAChR subunits in Neuro-2a cells, detected by RNA sequencing, are unaffected by 500 nm menthol treatment (24 h). For all panels, data are mean ± SEM; *p < 0.05; **p < 0.01; ***p < 0.005 (unpaired t test). For all panels, number in parenthesis indicates n value.

