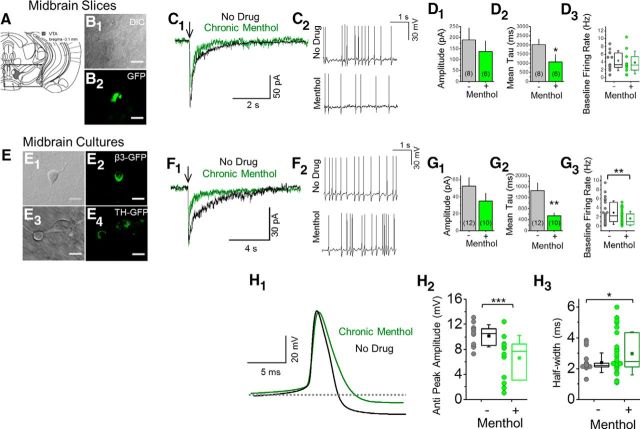
Figure 2.
In midbrain DA neurons, chronic menthol does not significantly alter ACh-induced response amplitudes but accelerates their decay and decreases the baseline firing rate. A–D, Midbrain slices; VTA DA neurons, bregma ∼−3.1 mm. B1, B2, Fluorescent neurons in slices from α6-GFP mice. C1, Currents induced by ACh puffs. C2, Baseline current-clamp traces for no drug-treated and for menthol-treated mice. E–H, Midbrain cultures; putative DA neurons. E1–E4, Fluorescent neurons from β3-GFP or TH-GFP mice. F1, Currents induced by ACh puffs. F2, Baseline current-clamp traces for no drug-treated and for chronic menthol-treated neurons. D1, D2, G1, G2, Summary of ACh response amplitude and decay time constant. D3, Histograms for DA neuron firing frequency for vehicle-treated and menthol-treated mouse brain slices (n = 16 and 11 for vehicle treated and menthol treated, respectively). G3, Histograms for DA neuron firing frequency for no drug-treated and menthol-treated cultured neurons (n = 23 and 31 for no drug treated and menthol treated, respectively). E–H, Chronic menthol treatment with cultured midbrain DA neurons was 500 nm, 7–10 d. H, Chronic menthol alters action potential properties of midbrain DA neurons. H1, Mean action potential spike waveform for a no drug-treated and menthol-treated midbrain DA neuron. H2, H3, Quantification of antipeak amplitude and action potential half-width. H2, n = 12 for both no drug-treated and menthol-treated cultured DA neurons. H3, n = 19 and 26 for no drug-treated and menthol-treated cultured DA neurons, respectively. In all cases (C1, F1), arrows indicate 100 ms puff of 300 μm ACh. D1, D2, G1, G2, For all bar graphs, number in parenthesis indicates n value. Data are mean ± SEM; *p < 0.05; **p < 0.005 (unpaired t test).

