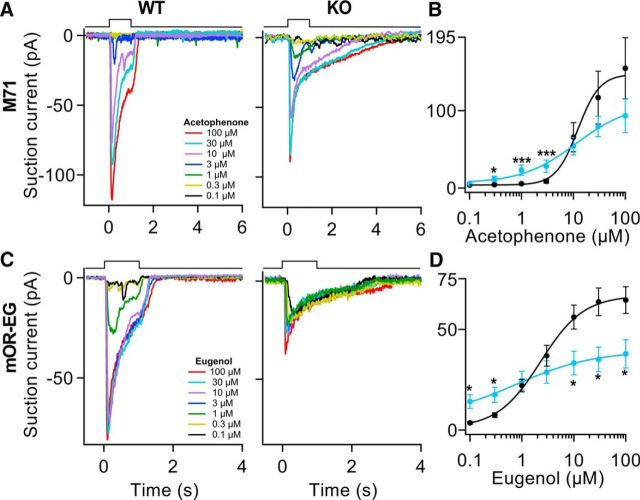
Figure 2.
OMP regulates odorant sensitivity. A, Acetophenone responses from OMP WT and KO M71-expressing ORNs stimulated at increasing concentration from 0.3 to 100 μm. B, The dose–response curve indicates that at 0.3, 1, and 3 μm the peak amplitudes were 2.7-fold, fourfold, and threefold larger in the OMP KO (blue curve) M71-expressing ORNs than in the OMP WTs (black curve). n = 6–7 ORNs. C, Eugenol responses from mOR-EG-expressing ORNs stimulated at increasing concentration. D, In this case we observed 4–5-fold larger responses at 0.1 and 0.3 μm in the OMP KOs (blue trace) and on average twofold smaller at 10, 30, and 100 μm. n = 14–22 ORNs. *p < 0.05, ***p < 0.005, unpaired Student's t test. All data are expressed as mean ± SEM.

