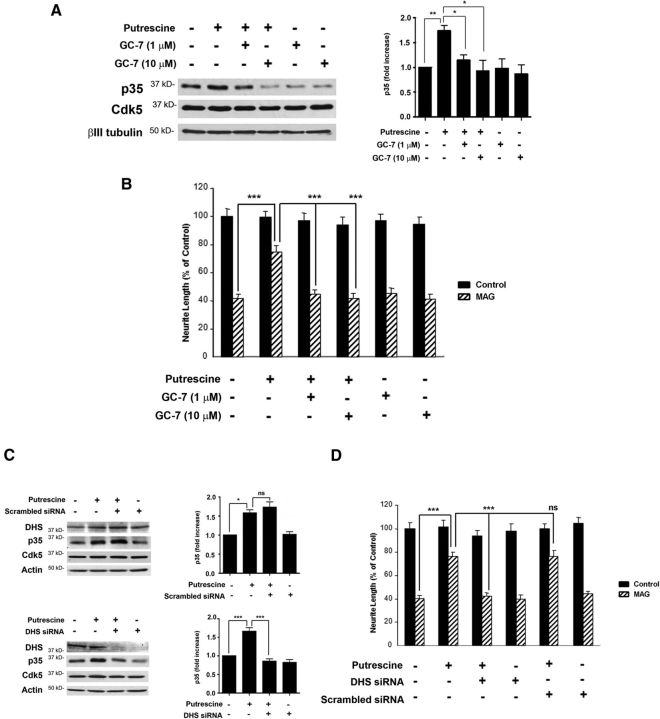
Figure 6.
Loss of DHS activity abolishes putrescine's ability to induce p35 expression and overcome inhibition by MAG. A, Western blots of CGNs treated with 100 μm putrescine and 1 or 10 μm GC-7 for 20 h (n = 3). The graph represents densitometric measurements that have been normalized to the control (untreated neurons) and depicted as average fold changes ± SEM. B, Quantification of neurite outgrowth for CGNs primed with 100 μm putrescine and 1 or 10 μm GC-7 and plated on monolayers of control or MAG-expressing CHO cells. C, Western blots of CGNs treated with 100 μm putrescine and 300 nm scrambled siRNA for 20 h (n = 3), and CGNs treated with 100 μm putrescine and 300 nm DHS siRNA for 20 h (n = 3). Graphs represent densitometric measurements that have been normalized to the control (untreated neurons) and depicted as average fold changes ± SEM. D, Quantification of neurite outgrowth for CGNs treated with 100 μm putrescine and 300 nm DHS or scrambled siRNA and plated on monolayers of control or MAG-expressing CHO cells. For all experiments, neurite outgrowth was measured from a minimum of 200 neurons for each treatment. Graphs represent the average length of the longest neurite per neuron (depicted as percentage of control) ± SEM. *p < 0.05; **p < 0.01; ***p < 0.001. ns, Not significant.

