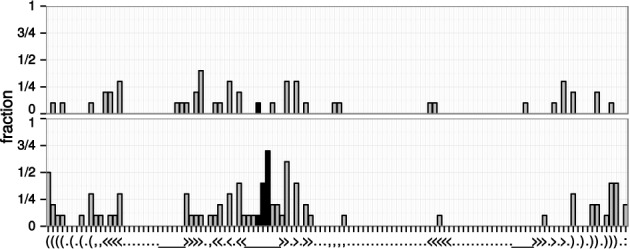
Figure 4.

Fraction of the 10 analyzed data sets that show tRNA specific modification in an alignment column for the control (top) and remolded tRNAs (bottom). The consensus secondary structure is shown along the plot. The anticodon positions are highlighted by black bars.
