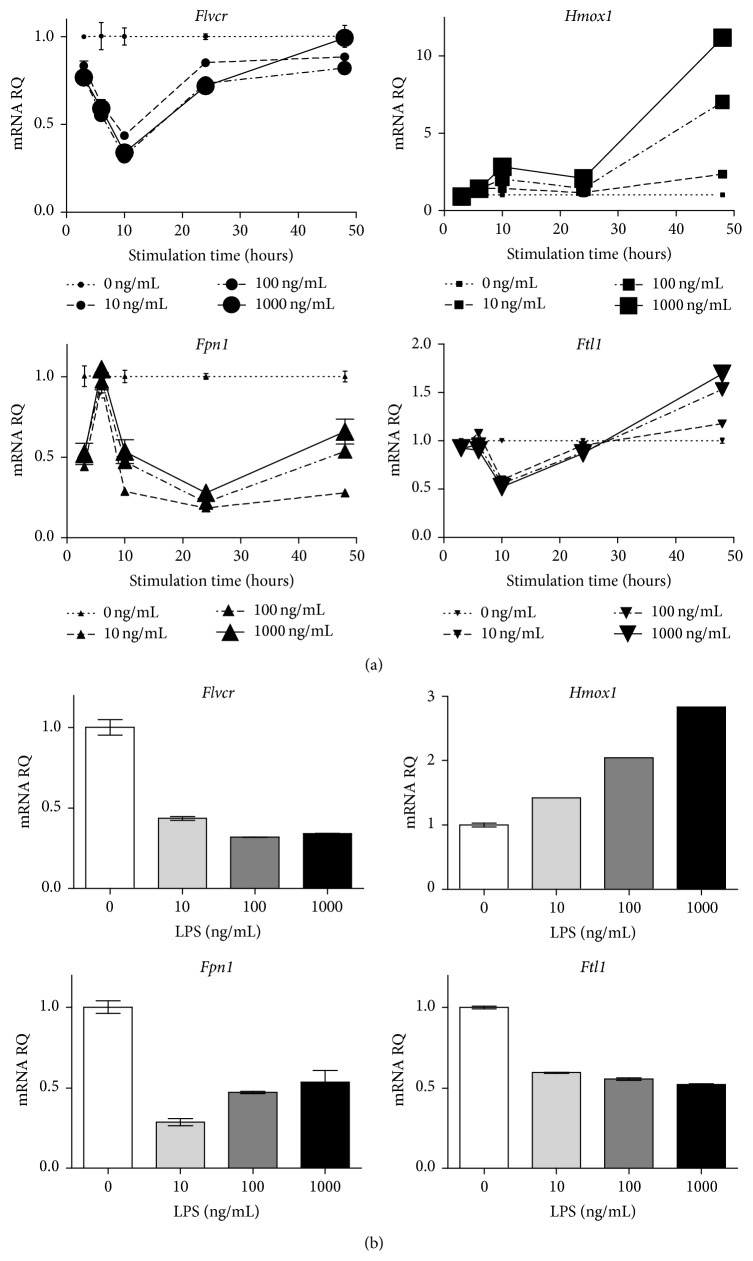
Figure 2.
Macrophages downregulate Flvcr in response to LPS stimulation. (a) J774 cells were stimulated with LPS at varying doses and times. Multiplex qPCR was then performed to assess mRNA levels of Flvcr, Fpn1, Hmox1, and Ftl1. The maximal decrease in Flvcr expression occurred at 10 hours and then recovered to baseline. (b) mRNA levels from the 10-hour time point in (a) are shown as bar graphs to demonstrate that Flvcr downregulation was LPS dose-responsive. Expression levels are shown as mRNA relative quantity (RQ) of LPS-treated cells relative to nontreated cells and normalized to β-actin expression. The mean and range of duplicate samples are shown. The data is representative of 3 independent experiments.

