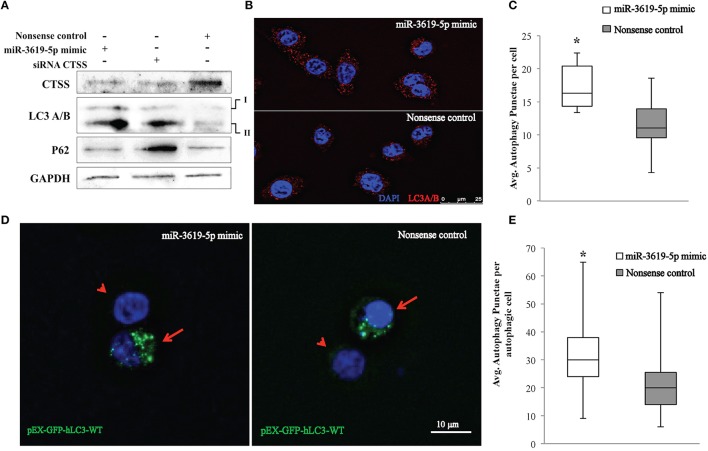
Figure 3.
Detection of autophagy in THP-1 cells transfected with miR-3619-5p mimics. (A) Expression of CTSS in THP-1 cells was down-regulated after transfection with miR-3619-5p mimics as well as siRNA, which affected the process of autophagy observed by LC3A/B conversion on western blots. (B) LC3 autophagy puncta were observed under the microscope, (C) and were significantly increased in miR-3619-5p mimics transfected cells compared to nonsense controls as calculated by ImageJ. (D) LC3-GFP autophagy puncta were also observed with pEX-GFP-hLC3-WT plasmids. Co-transfecting cells with miR-3619-5p with pEX-GFP-hLC3-WT plasmid produced more autophagy GFP-LC3 puncta than that of co-transfected cells with nonsense control and pEX-GFP-hLC3-WT plasmid as observed under fluorescent microscope. Arrow indicates co-transfected cells and arrowhead indicates non-transfected population. (E) Significant differences in number of autophagic GFP-LC3 puncta was observed between two groups counted by ImageJ. The columns show means of three biological replicates each measured in triplicates while error bars show the standard deviation. Asterisks indicate statistical significance between samples (*P < 0.05).

