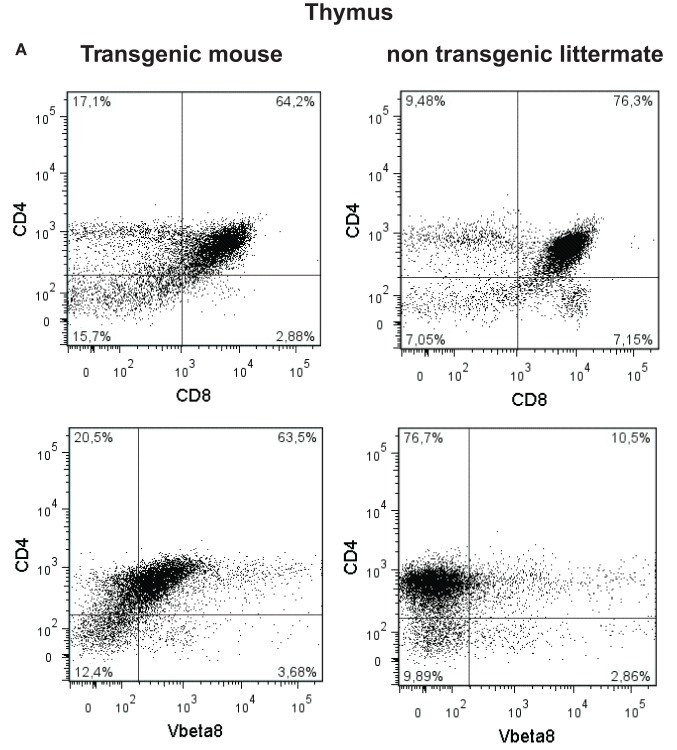
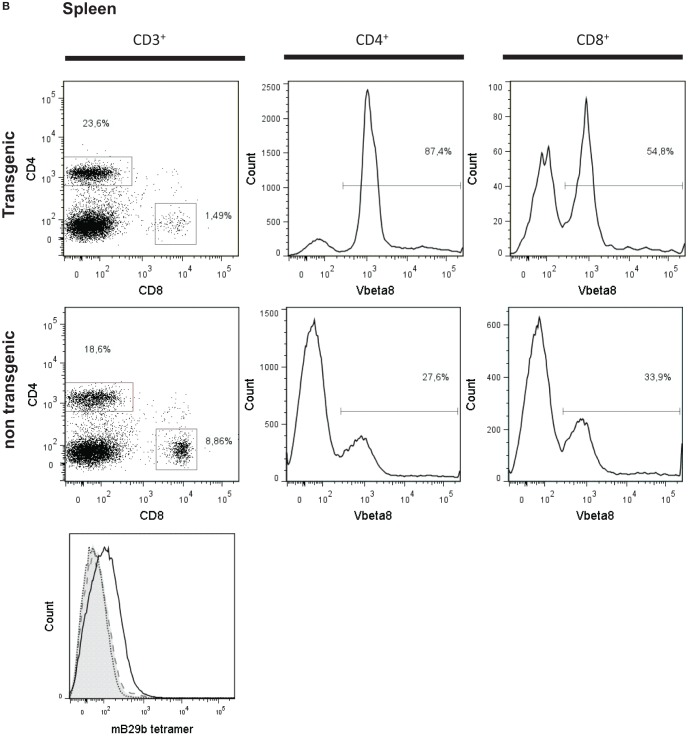
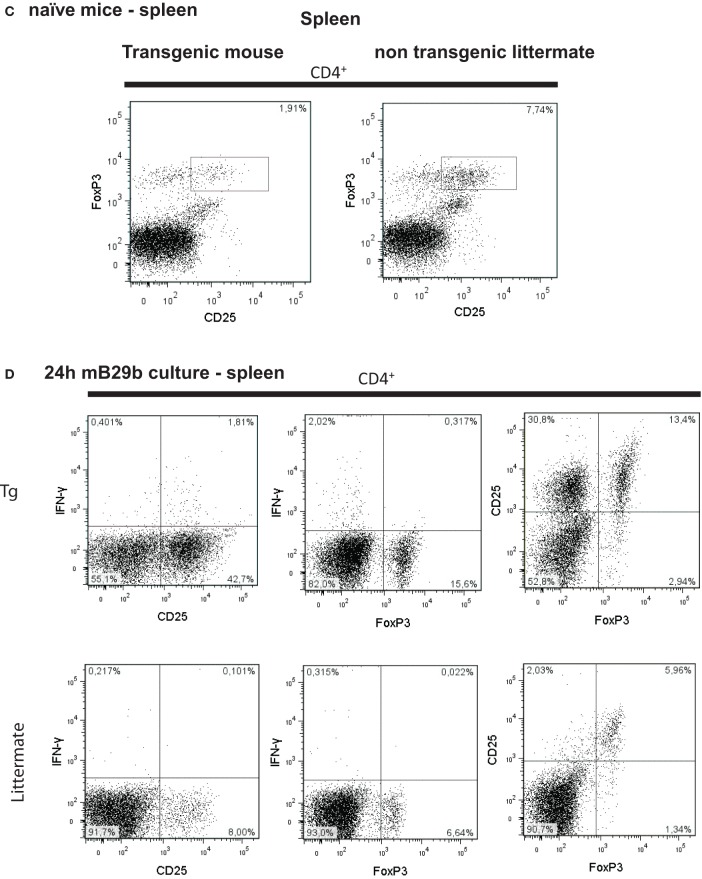
Figure 5.
CD4+ and CD8+ T cell distribution in tissues of mB29-TCR transgenic mouse. (A) Single cell suspensions were made from thymus of mB29b-TCR transgenic mice or negative littermates. Cells were stained for the expression of CD3, CD4, CD8, and Vβ8. Live cells were gated on the forward scatter (FSC) and side scatter (SSC) and the percentage of CD4+ and CD8+ cells of the live cells are depicted in the upper panel of (A). In the lower panel of (A), the percentage of CD4+Vβ8+ of all live cells is shown. The different CD4+ and CD8+ T cell distribution of the mB29b-TCR transgenic mouse compared to non-transgenic littermates is due to the transgenic background, in which formation of T cells is changed. Plots shown are representatives of three independent experiments. (B) Distribution of CD4+ and CD8+ cells in the CD3+ cells (left row of graphs), histograms of CD4+ cells (middle row of graphs) and CD8+ cells (right row of graphs) of total CD3+ cells are depicted. The transgenic mouse shows an increase in CD8+Vβ8+ and CD4+ Vβ8+ T cells compared to the non-transgenic littermate. The overlay histogram at the bottom of (B) represents the amount of mB29b-specific CD4+ T cells in a WT Balb/c (filled gray), a negative littermate (dashed line), and an mB29b TCR Tg mouse (black line). The dotted line shows splenocytes stained with a CLIP tetramer as negative control. Each line represents three different mice. (C) CD25 and FoxP3 expression measured within de CD4+ population of splenocytes derived from naive mice. (D) CD25, IFN-γ, and FoxP3 markers are measured by flow cytometry upon 24 h culture of splenocytes from both negative littermates as transgenic mouse in the presence of mB29b.


