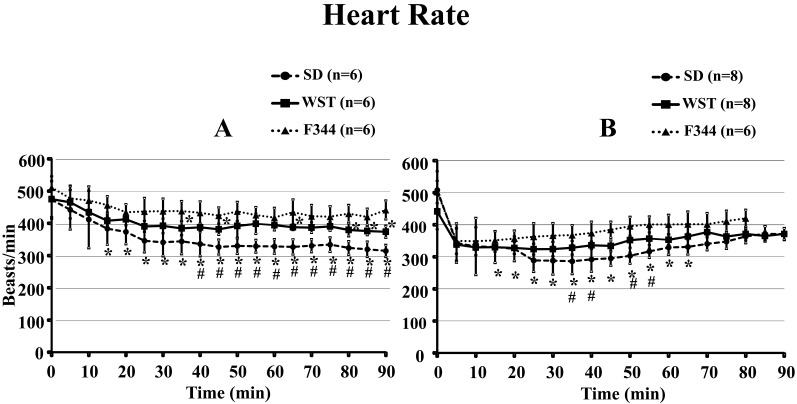
Fig. 5.
Time courses of heart rate of the SD, WST, and F344 rat strains administered saline (A) or the anesthetic mixture (B). Data are presented as means ± SD. Differences between strains were analyzed by one-way repeated measures ANOVA followed by Scheffe’s test. A P value less than 0.05 was considered to be statistically significant. *P<0.05 compared with the F344 strain. #P<0.05 compared with the WST strain.

