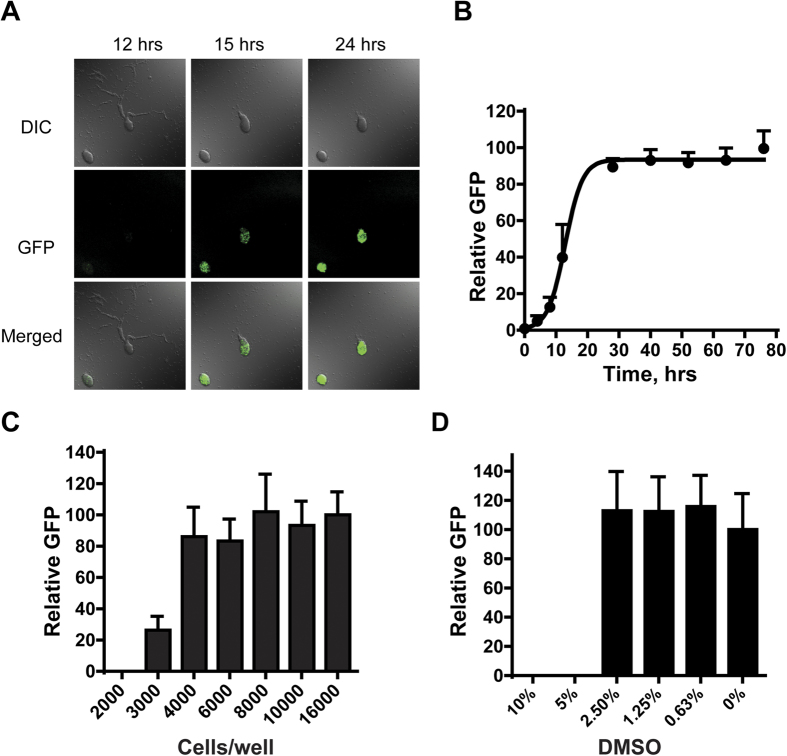
Figure 2. Optimization of Dictyostelium chemotaxis-dependent aggregation assays.
(A) Time course of reporter GFP expression during Dictyostelium chemotaxis and aggregation. Cells were incubated in starvation buffer for various times and visualized by differential interference contrast (DIC) and fluorescent confocal (GFP) microscopy (see Supplementary Movie 1). (B) For measuring time course of GFP expression in 1536-well plate format, cells were seeded into plates and assayed at times indicated for GFP signal intensity (with standard deviations) with the Acumen eX3 laser scanning cytometer. The data are representative of two independent experiments. (C) For cell density optimization, cells were deposited in 1536-well plates at different densities and GFP intensity (with standard deviations) measured after 48 hr. (D) For evaluation of DMSO effects, 8,000 cells per well were incubated with different concentrations of DMSO and GFP intensity (with standard deviations) was measured after 48 hr.

