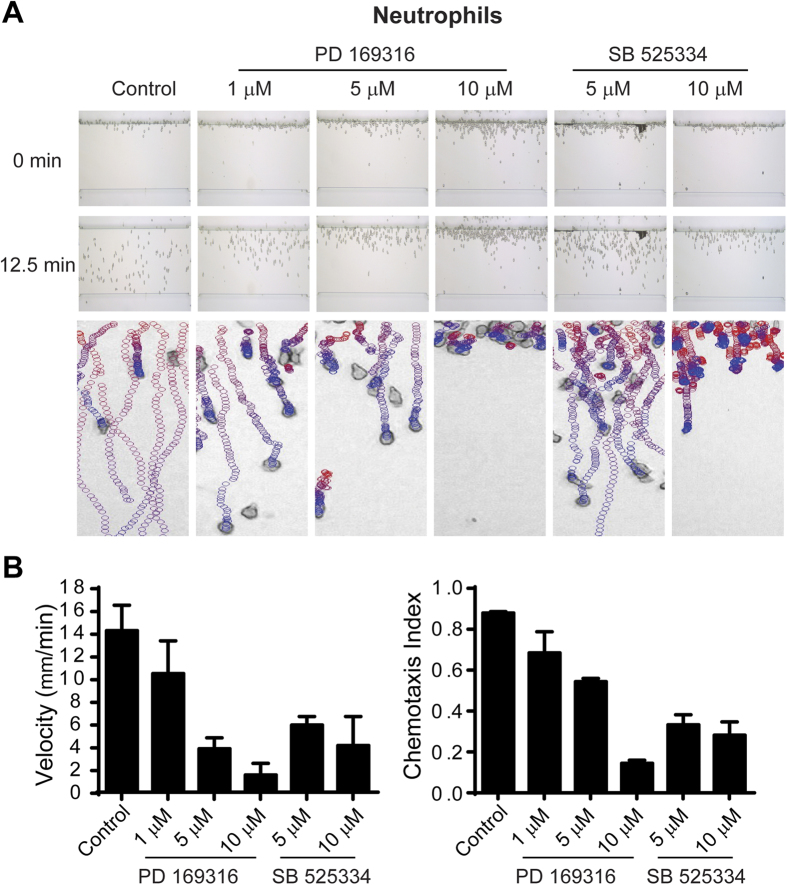
Figure 5. Validation of inhibitory effects of compounds PD 169316 and SB 525334 on human neutrophil chemotaxis in EZ-TAXIScan assays.
(A) Human neutrophils were treated with various doses of PD 169316 and SB 525334 and assayed for chemotaxis within an fMLP gradient by EZ-TAXIScan. Top and middle panels: the images show the positions of cells at 0 and 12.5 min of chemotaxis; at 12.5 min, control cells approach the end of the gradient (see Figure S2B). Bottom panels: The images show migratory paths of individual neutrophils during an entire (30 min) chemotaxis assay. Cells are depicted in migratory tracts as circles, progressing from red to blue during increasing times of the assay. For clarity, only cells that moved in ten consecutive frames are shown. Non-moving (e.g. stationary) features are ignored by the algorithm, which compares objects among multiple images. Data are representative of three independent experiments. (See Supplementary Movie 3). (B) Chemotaxis parameters were calculated using data obtained from (A). The chemotaxis velocity was computed as the total chemotaxis path length divided by time. The chemotaxis index was computed as the ratio of net path length toward fMLP compared to the total path length.

