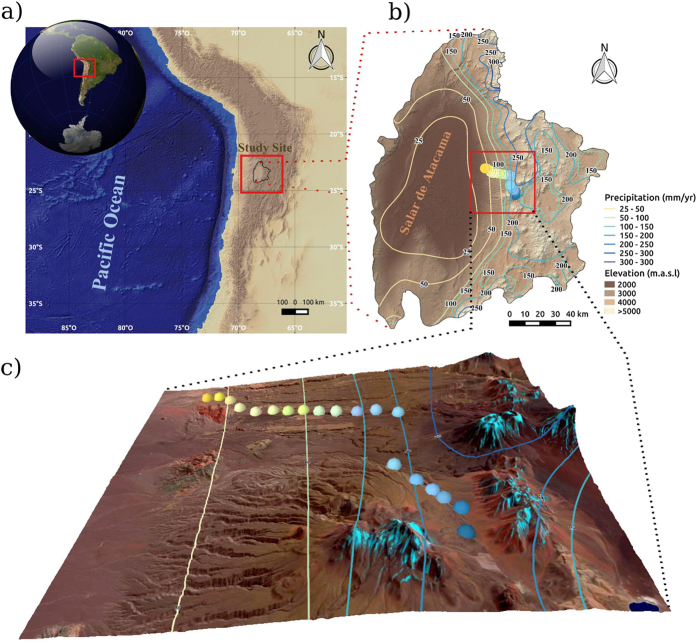
Figure 1. Study site, climate and sampling sites in northern Chile.
Regional context of northern Chile showing location of the Salar de Atacama and adjacent Andes (right inset) and a digital elevation model indicating where our sampling sites (lower inset, colored dots) are along the Talabre-Lejía Transect (TLT). Isohyets are in the same corresponding color as the respective sampling sites. The software used to create the map was QGIS 2.10 with Openlayer plugin, STRM3053,54 elevation model (Data: SIO, NOAA, U.S. Navy, NGA, GEBCO) and Landsat 8 Satellite image (Data available from the U.S. Geological Survey).

