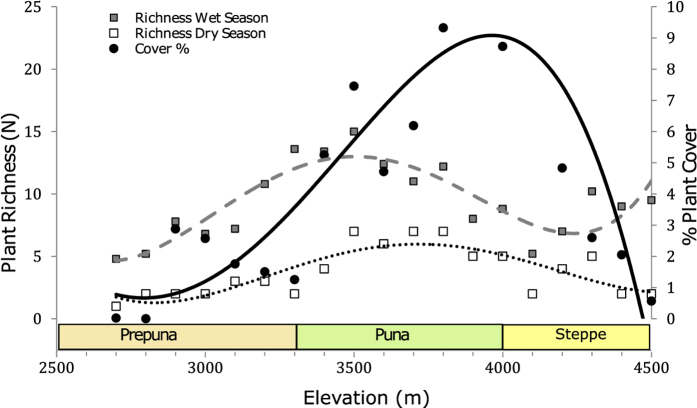
Figure 2. Average % plant cover and plant species richness for the Talabre-Lejía Transect (TLT).
Plant species richness and plant cover were estimated using the McAuliffe log-series survey method48 using two replicate plots of 250 m2 each. Circles (•) represent the plant cover % during the wet season. Squares represent richness or number of species during the wet season (▪) in April, and dry season (□) in July. Best-fits are indicated by polynomial regressions and are plotted to show overall trends in the data.

