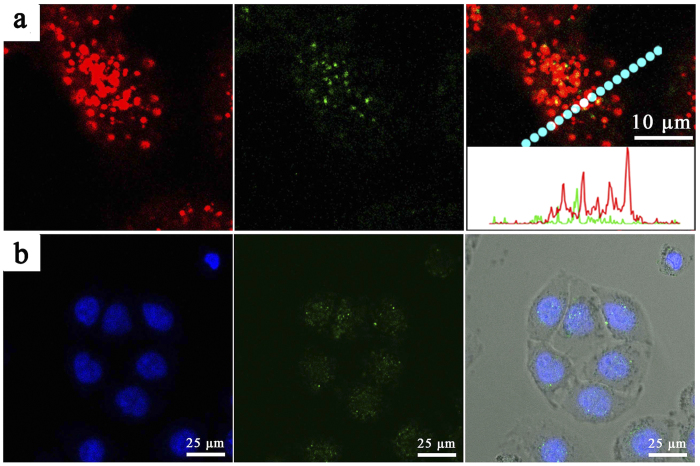
Figure 5. CLSM image of HeLa cells treated by inactive GNPs-ES in which 5′ end of substrate stand was fluorescence labeled with FAM.
(a) The blue fluorescence from Hoechst 33342 revealed the location of cell nuclei while the green color from FAM indicated the distribution of GNPs-ES. (b) The red color came from endo-/lysosomes stained by LysoTracker Red while the green color from FAM. Inset is the line-scan profiles of fluorescence intensity variation for HeLa cells along the marked line.

