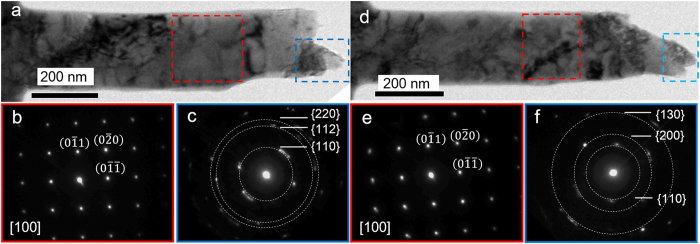
Figure 4. Single crystal to poly-crystalline transformation.
(a,d) Typical TEM images showing two fractured nanowires (b,c,e,f) and SAEDPs corresponding to the red and blue framed regions in (a,d). The white dotted circles in (c,f) mark the splitting diffraction spots, and the measured angles between the splitting diffraction spots are below 20°.

