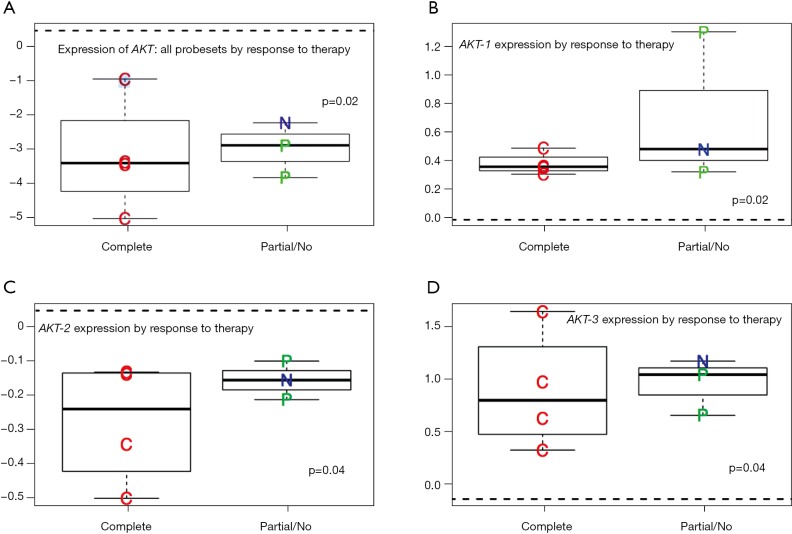
Figure 3.
(A) AKT all isoforms expression correlated to pathologic response to NCRT (mean diff. =−3.35 for pCR vs. pPR/pNR P=0.02); (B) correlation between AKT-1 expression and pathologic response to NCRT (mean diff. =0.39; P=0.002); (C) correlation between AKT-2 expression and pathologic response to NCRT (mean diff. =0.32, P=0.04); (D) correlation between AKT-3 expression and pathologic response to NCRT (mean diff. =0.58, P=0.04). NCRT, neoadjuvant chemoradiation; pCR, pathologic complete response; pPR, partial pathologic response; pNR, pathologic non-response.

