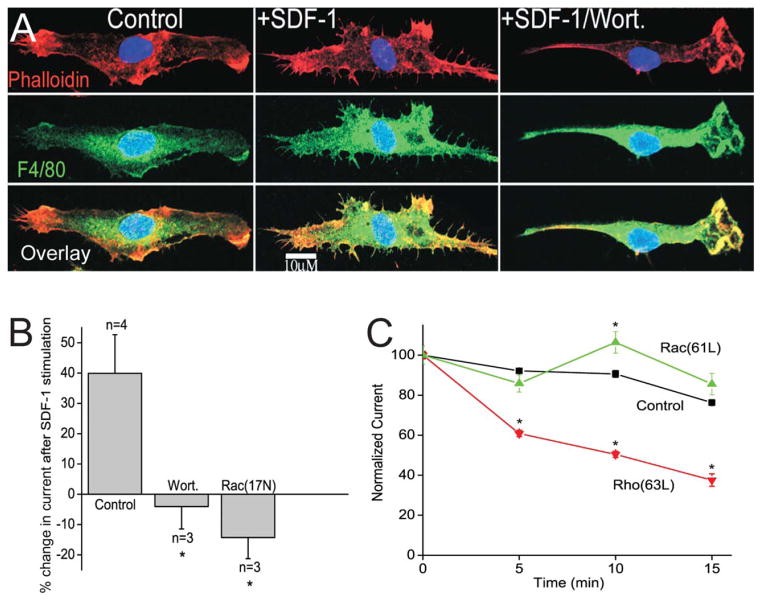
FIGURE 4.
SDF-1α signaling involves PI3-kinase and the small GTPase Rac. A: Left panels show a control untreated microglia, the middle panels shows SDF-1α (100 nM) treated microglia and the right panels show microglia treated with SDF-1α (100 nM) and wortmannin (50 nM). The top panels show actin stained red with Alexafluor 594-conjugated phalloidin; middle panel shows the microglia marker in green with FITC-conjugated F4/80 antibody and bottom panel shows an overlay image with yellow showing areas of colocalization. B: Percent change in Kir2.1-like current amplitude after exposure to SDF-1α (100 ng/mL). Bath application of wortmannin (50 nM) or expression of dominant-negative Rac (17N) prevented stimulation of the current by SDF-1α. C: Time course of change in normalized peak current in control cells (control, black, n = 6) and cells dialyzed with 6 μg/mL constitutively active Rac1 protein (61L, green, n = 6) or constitutively active RhoA protein (Rho 63L, red, n = 5) from the patch-pipette into the cell. The currents were normalized to the current amplitude at the start of the experiments to allow comparison between cells. *P < 0.05.

