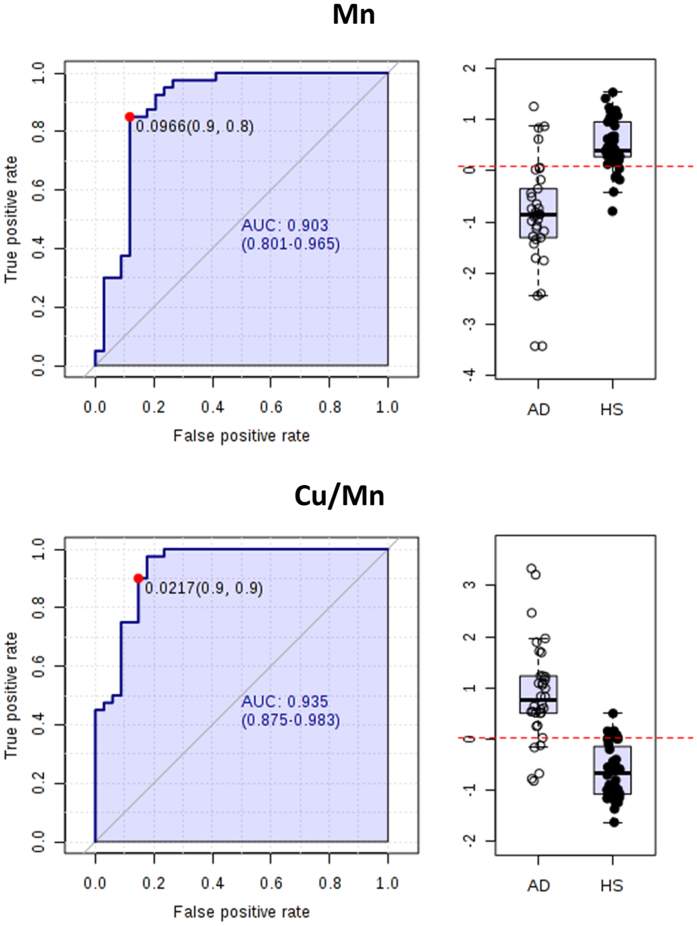
Figure 5. Univariate ROC curves analysis individuated Cu and the ratio Cu/Mn as two potential biomarkers for discriminating between AD and HS samples.
AUC = Area under the curves. The confidential interval is also provided. Plot bars were obtained using normalized concentration as described in methods.

