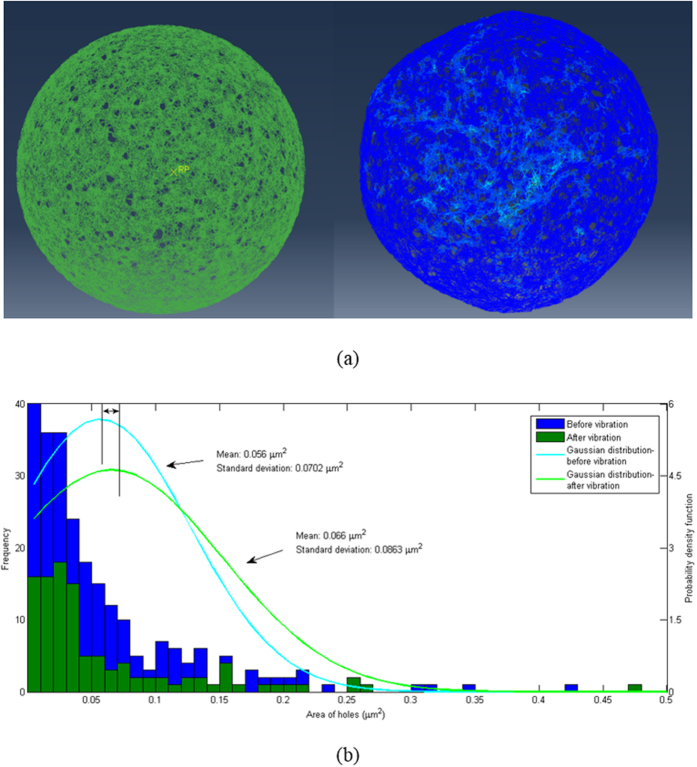
Figure 6. Finite-element simulation of the cytoskeleton cortex.
(a) Typical simulated configurations of the cortex structure before (left) and after (right) 5 cycles of vibration. An attached movie shows the simulated oscillations. (b) Frequency plots of the pore areas on the cortex layer, and fitted Gaussian distributions, before and after 5 cycles of vibration.

