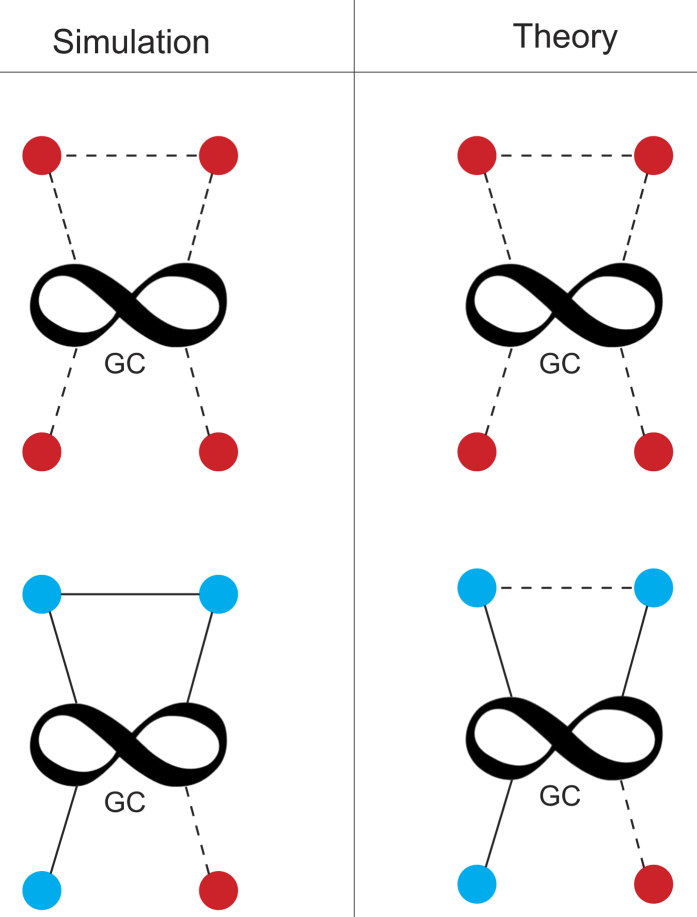
Figure 3. Schematic comparison of the rules of the recovery strategy between theory and simulations.
In the left panel we show the rules for the simulations and in the right panel the rules for the theory. For simplicity we show only one of the coupled networks. The infinity symbol indicates the Giant Component (GC), red nodes are boundary failed nodes, while blue nodes are boundary recovered nodes. The dashed lines indicate inactive connections and the solid line reactivated connections. In the simulations a connection between two boundary recovered nodes is restored, which is not contemplated in the theory. In this case γ = 3/4, and boundary nodes have only one connection to the GC for simplicity.

