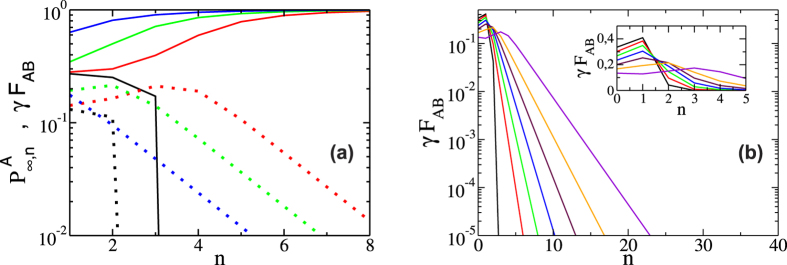
Figure 6.
Log-Linear plot of (a) fraction of nodes in the GC of A,  (solid lines) and the fraction of repaired nodes in the mutual boundary γFAB (dot lines) as a function of n for p = 0.391 (black), p = 0.392 (red), p = 0.4 (green) and p = 0.48 (blue). The black full and dotted lines denote the value of p in the Collapse region. In red and green are the regions of Collapse-Recovery curves and in blue the Recovery region (b) fraction of repaired nodes in the mutual boundary γFAB as a function of the iteration step n in the recovery region, with p = 0.4 from left to right γ = 1 to γ = 0.4 in intervals of 0.1. The inset shows the maximum of γFAB located at the first steps of the process. The curves where obtained for RR networks with z = 5, from the theoretical approach.

