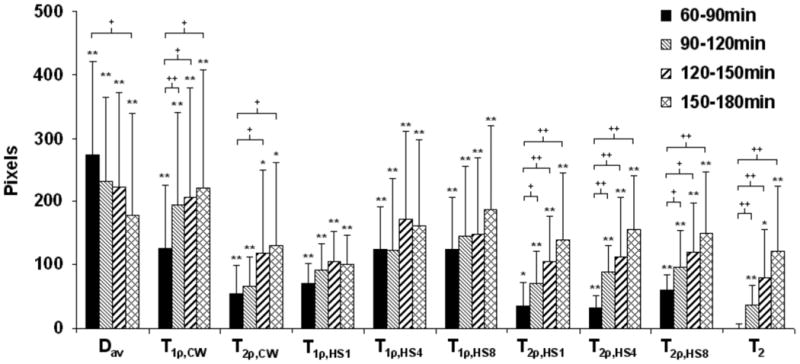
FIG. 5.

Threshold analysis showing the progression of the lesion area at four time points after MCAo. Data are presented as difference (ipsi-contra) in the number of pixels in striatum and cortex with values over 115% (or under 85% for diffusion) of the mean value in contralateral side (for details see Methods). Data are shown as mean ± SD. Significance is shown as follows: * p < 0.05, ** p < 0.01, different from zero; + p < 0.05, ++ p < 0.01, different from the first time point.
