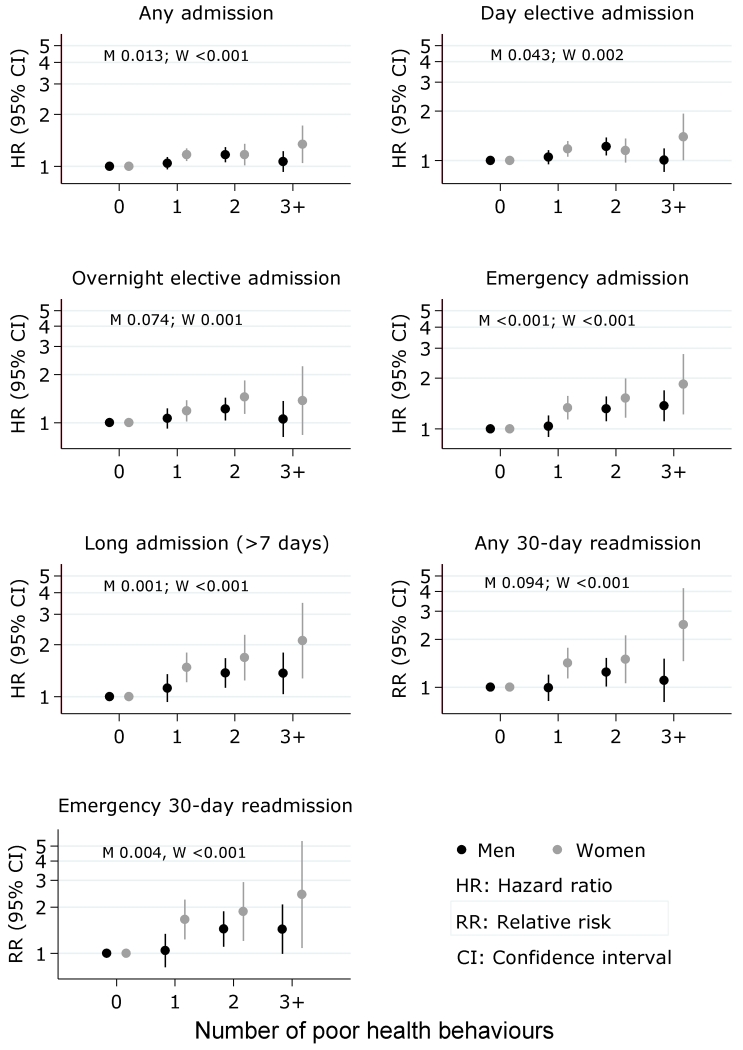
Figure 1. Unadjusted associations between number of poor health behaviours and risk of admission outcomes among men and women.
Poor health behaviours: low physical activity (activity score ≤50), poor diet (prudent diet score in bottom quarter of distribution), high alcohol consumption (men: >21 units per week, women: >14 units per week), current smoker.
Number of poor health behaviours was coded as 0, 1, 2 and 3 or more.
The horizontal axis of all sub-plots shows the number of poor health behaviours
P-values were calculated for men (M) and women (W) using an ordinal variable to represent number of poor health behaviours (1, 2, 3 and 4).
Death was included as an alternative failure event in all instances.

