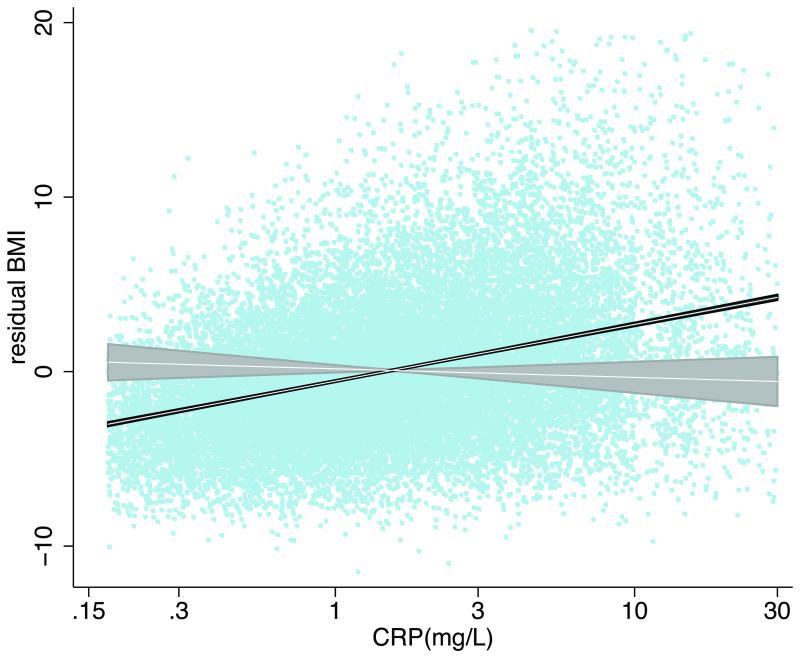
Figure 2.
Comparison of linear relationships between residual BMI and circulating CRP observationally and when estimated employing the CRP locus rs3091244 as an instrument for log transformed CRP.
X and Y axes represent CRP and residual BMI respectively.
Light blue points represent a scatter plot of the correlation between circulating CRP and residual BMI.
Grey areas represents 95% confidence regions around instrumental variables estimates.
Black area represents 95% confidence regions around simple linear regression estimates.
(The 50 individuals with extreme residual BMI over 20 kg/m2 are not shown on the plot but were included in the analyses that gave the fitted lines and confidence regions.)

