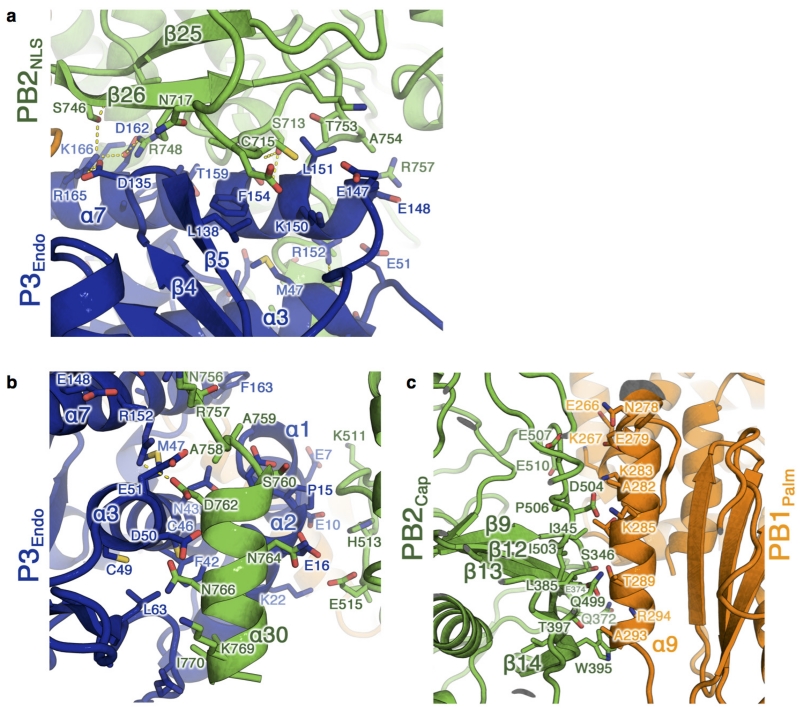
Extended Data Figure 4. New subunit interfaces in apo-FluPolC.
a, b, Two views of the interaction interface between PB2NLS (green) and P3endo (blue). Predicted polar contacts between the subunits are shown as dotted yellow lines. c, The interface between PB2cap (green) and PB1palm (orange). In all panels, residues at the interface were calculated using the ‘Protein interfaces, surfaces and assemblies’ service PISA at the European Bioinformatics Institute (http://www.ebi.ac.uk/pdbe/prot_int/pistart.html)43.

