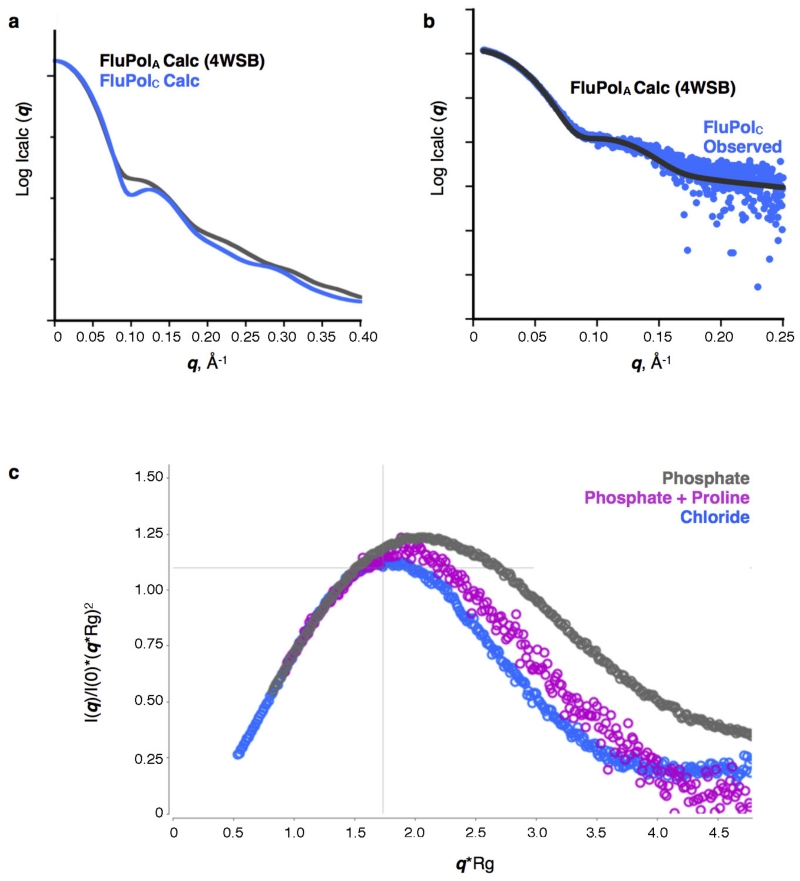
Extended Data Figure 5. SAXS analysis of FluPolC.
a, Calculated solution-state SAXS profiles for the crystal structures of vRNA-FluPolA3 (activated conformation) and apo-FluPolC (closed conformation). A distinguishing difference between these profiles is the dip at q ~0.1 Å−1 in the FluPolC curve. b, Solution-state SAXS profile of FluPolC, without added promoter RNA, overlaid with the calculated curve for the vRNA-FluPolA structure3. The good match between these curves suggests that in this particular buffer (0.5 M NaCl, 25 mM HEPES-NaOH, pH 7.5, 5% (v/v) glycerol), FluPolC adopts the same globular conformation as the RNA bound state. c, Dimensionless Kratky plot of apo-FluPolC in the presence of 0.5 M NaCl, 25 mM HEPES-NaOH, pH 7.5 and 5% (v/v) glycerol (blue) or 100 mM KCl, 2% (w/v) sucrose and 100 mM sodium phosphate, pH 7.3, with (magenta) or without (grey) 200 mM proline. Cross-hairs denote the Guinier–Kratky point (1.732, 1.104), the peak position for an ideal, globular particle. As indicated by the upward shift of the peaks in the dimensionless Kratky plot, FluPolC is less globular in the presence of phosphate than it is in the 0.5 M NaCl buffer. This effect can be lessened if proline is also present, potentially owing to increased molecular crowding.

