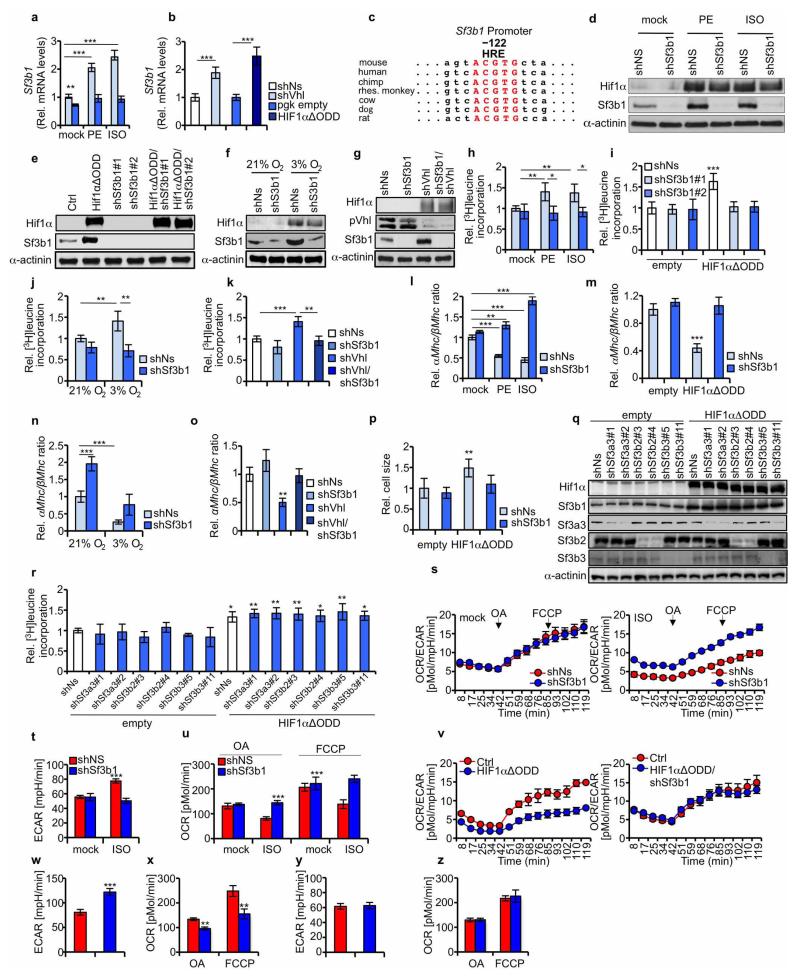
Extended Data Figure 2. SF3B1 is a HIF1α-target gene, whose product regulates growth and metabolic shift in vitro.
a, NMCs infected as denoted, were stimulated with either mock, phenylephrine and isoproterenol, respectively. Sf3b1 mRNA expression was examined by qPCR. (n = 3 biological replicates). b, NMCs were transduced as indicated and processed for qPCR analysis of Sf3b1 mRNA. (n = 3 biological replicates). c, Comparative analysis of a conserved HRE (shown in red) in the promoter of SF3B1 of diverse mammalian species located 122 bp downstream of the transcription start site (TSS). d–g, Immunoblot detection of indicated proteins of NMCs transduced with shNs, and shSf3b lentiviruses treated with phenylephrine or isoproterenol (d) co-infected with empty vector or HIF1αΔODD (e) cultured under normoxic (21% O2) or hypoxic (3% O2) conditions (f) and co-transduced with shVhl lentiviruses (g). h–o, Evaluation of [3H]leucine incorporation and the myosin heavy chain α/β mRNA expression ratio in NMCs treated with either phenylephrine or isoproterenol (h, l), HIF1αΔODD overexpression (i, m), hypoxia (j, n) or pVhl deletion (k, o), with or without shSf3b1 mediated Sf3b1 depletion. Obtained values are shown relative to incorporated radioactivity in control (shNS) NMCs (set as 1.0) (n = 4 per individual group). p, NMCs treated as in i were microscopically analysed for cell size using CellProfiler. Data represents 1 of 3 independent experiments with approximately 200 analysed cells per experiment. q, Lysates of NMCs treated as indicated, were assessed for protein expression of specified proteins by immunoblots. r, Evaluation of [3H]leucine incorporation of NMCs infected as indicated. Obtained values are shown relative to incorporated radioactivity in control (shNs/empty) NMCs (set as 1.0) (n = 3 per individual group). s–z, Assessment of extracellular acidification rate (ECAR), and oleic acid- and carbonyl cyanide-4-(trifluoromethoxy)phenylhydrazone (FCCP)-induced oxygen consumption rate (OCR) in NMCs transduced and treated as indicated. Highlighted ECAR measurements were done at baseline. All data are compared to shNs-transduced NMCs. (n = 8 biological replicates in the group shNs + isoproterenol; n = 10 biological replicates in all other groups). Error bars are s.d. (a, b, h–o, r) or s.e.m. (p, s–z). *P < 0.05; **P < 0.01; ***P < 0.001. Two-tailed unpaired t-test (b, t, u, w–z). One-way ANOVA followed by Dunnett’s multiple comparison post-test (a, h–p, r).

