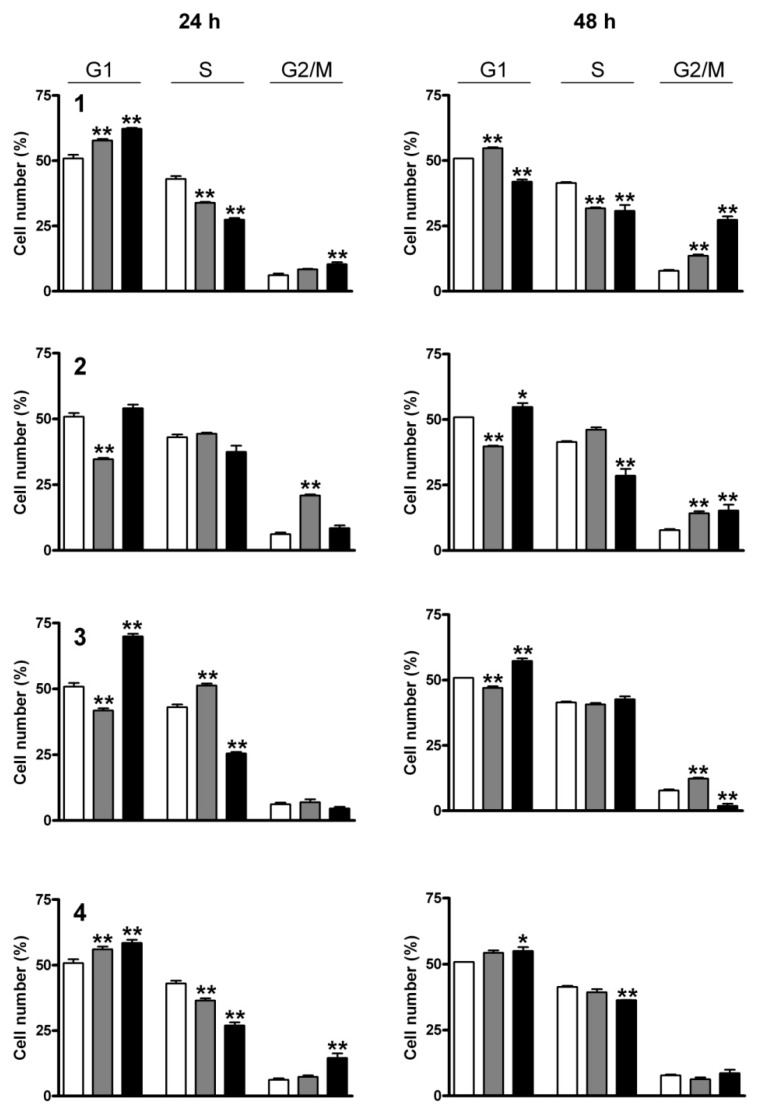
Figure 4.
Cell-cycle distributions of HL-60 cells after treatment with 1–4 for 24 and 48 h. Open, gray and black columns indicate data from control cells and cells treated with 5 or 10 µM test substance, respectively. * and ** denote p < 0.05 and p < 0.01, respectively, as compared with the control condition. Data are means ± SEM from three determinations.

