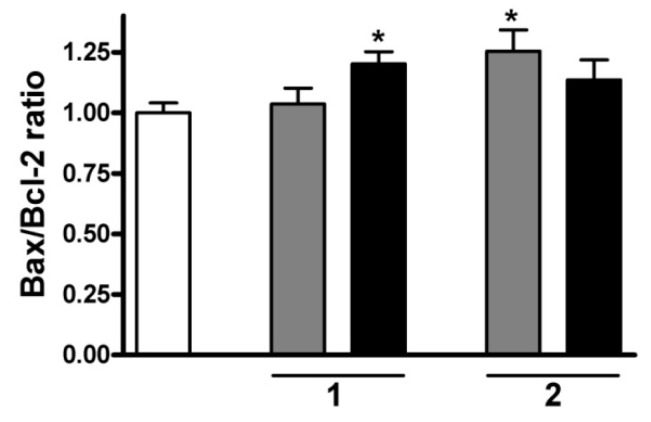
Figure 10.
Calculated ratios Bax/Bcl-2 at an mRNA level after incubation with compound 1 or 2 for 24 h. White, gray and black columns relate to the control, or 5 and 10 µM sesquiterpene, respectively. * denotes p < 0.05, as compared with the control condition. Data are means ± SEM from three determinations.

