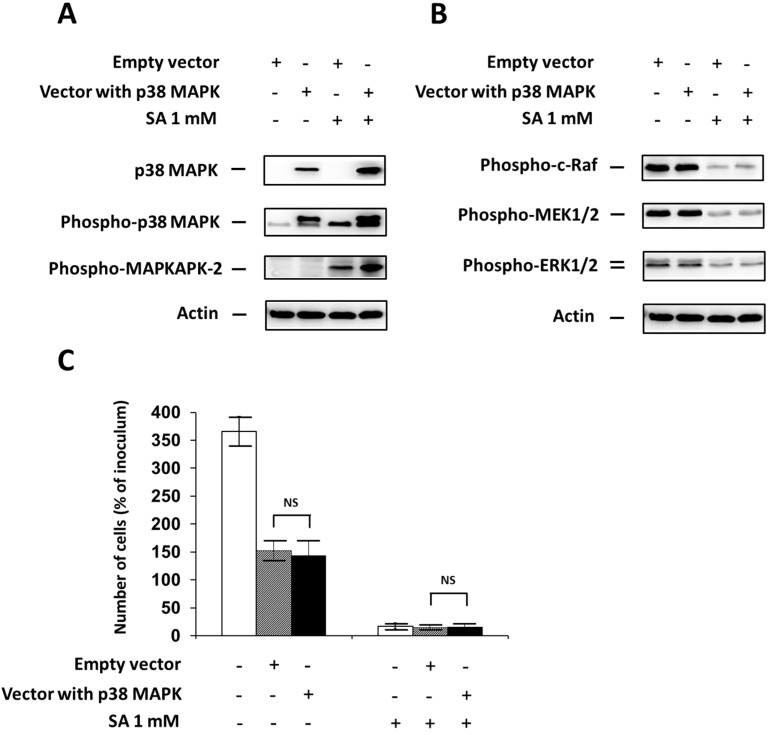
Figure 4.
Effect of p38 MAPK overexpression, using transfection with a specific plasmid (Vector with p38 MAPK) (see “Materials and Methods”) and the effect of stearic acid (SA) on (A) the level of p38 MAPK, phospho-p38 MAPK and phospho-MAPKAPK-2 (substrate of p38 MAPK); (B) the level of phospho-c-Raf, phospho-MEK1/2, phospho-ERK1/2 (the ERK signaling pathway); and (C) cell growth and viability of NES2Y cells. Cells transfected with an empty vector (Empty vector) represented control cells. After 18 h of incubation (see “Materials and Methods”) with or without stearic acid (SA) (A,B), the level of individual proteins was determined using Western blot analysis and the relevant antibodies (see “Materials and Methods”). A monoclonal antibody against human actin was used to confirm equal protein loading. The data shown were obtained in one representative experiment from three independent experiments. The fact that the band of p38 MAPK in the control samples is not visible here resulted from a large difference in p38 MAPK content in control and transfected cells. When assessing cell growth and viability (C), cells were seeded at a concentration of 2 × 10⁴ cells/100 µL of culture medium per well of 96-well plate (see “Materials and Methods”). The number of living cells was determined after 48 h of incubation with or without SA. Each column represents the mean of four separate cultures ± SEM. NS (non-significant) when comparing the number of cells incubated with plasmid DNA containing p38 MAPK (Vector with p38 MAPK) and cells incubated with empty plasmid DNA (empty vector).

