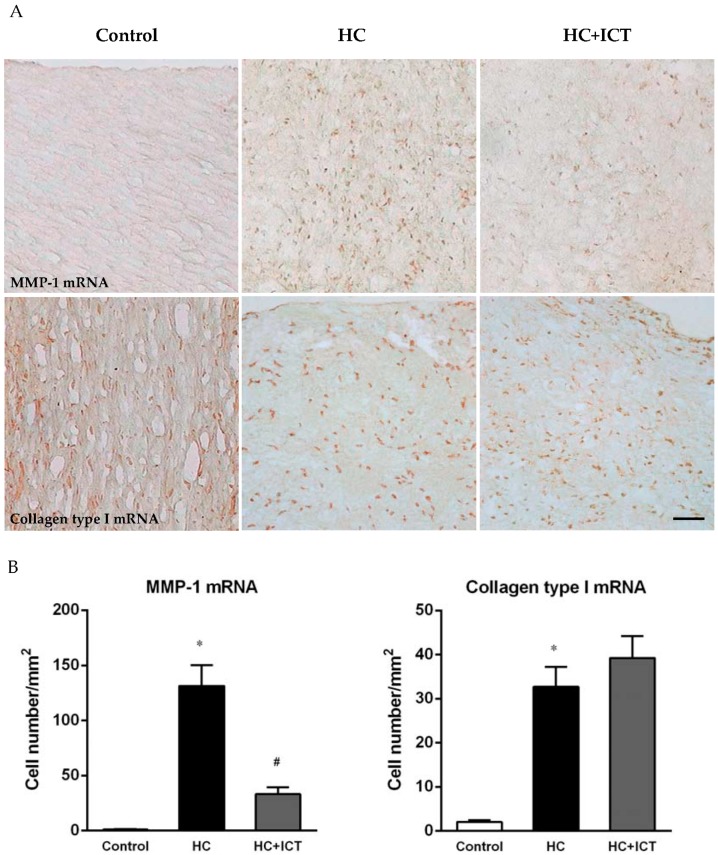
Figure 4.
ICT lowered MMP-1 mRNA expression in intima of aorta. (A) Representative images of in situ hybridization for MMP-1 and collagen type I mRNA in cross sections of aorta from control, HC, and HC+ICT groups. Scale bar = 50 µm; (B) Number of MMP-1 mRNA- and collagen type I mRNA-positive cells per mm2 intima. * p < 0.05, between control and HC groups; # p < 0.05, between HC and HC+ICT groups. n = 9. Data were means ± SEM.

