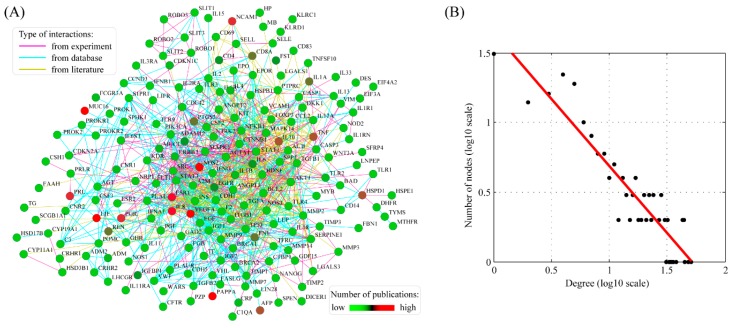
Figure 2.
The gene network underlying ectopic pregnancy susceptibility genes. (A) The structure of the gene network generated by the STRING software. The number of publications for each gene was represented in color gradient with a scale bar; (B) Degree distribution of the gene network. The degree distribution follows a power law distribution. With 95% confidence interval, the scaling exponent is estimated to be 0.9614 ± 0.1346.

