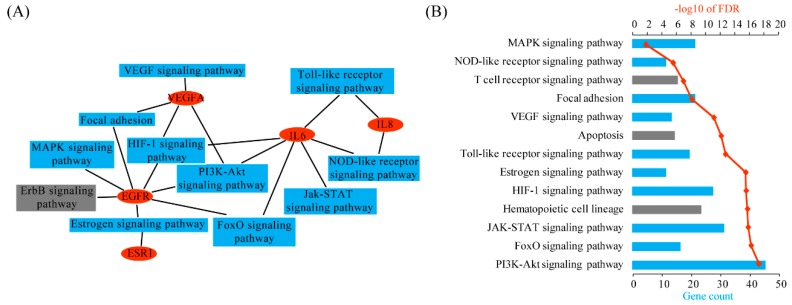
Figure 4.
Pathway analysis. (A) Pathway assignment for the top five genes recommended by the TM-rank algorithm. This graph was generated by using the Cytoscape software. Ellipse nodes in red represent genes and rectangle nodes in blue represent pathways; (B) Pathway enrichment analysis for all the 264 genes identified by text mining. This analysis was performed by using the DAVID tool. The significance cutoff for FDR was set at 0.01.

