Figure 6.
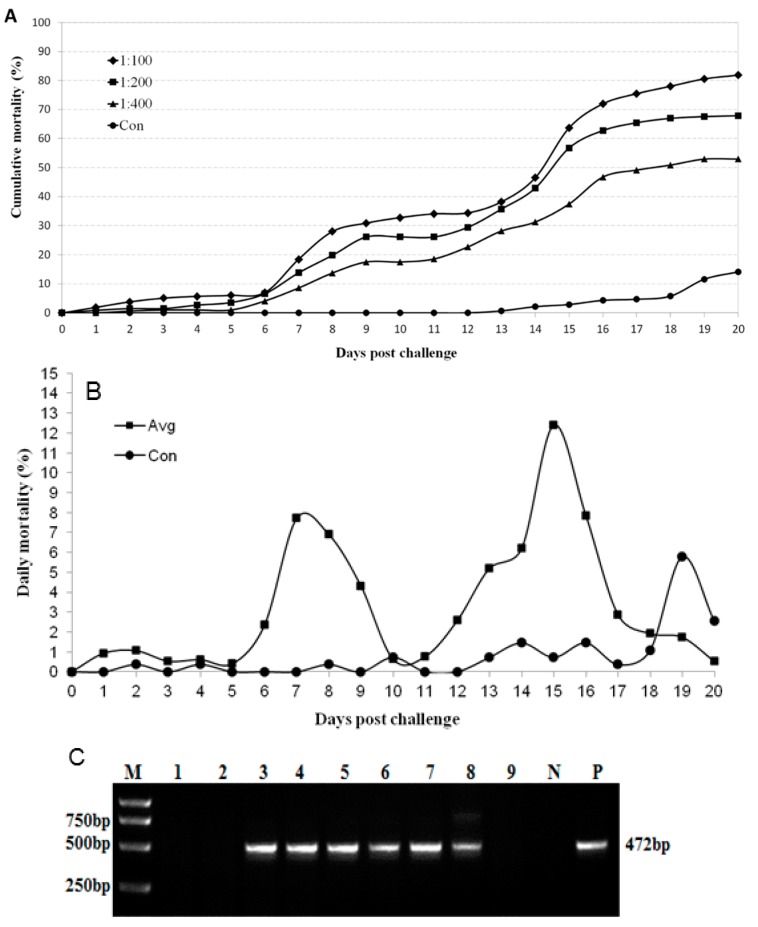
Experimental infection of M. rosenbergii with MrTV. Curves of cumulative mortalities in each group (A) or daily mortalities in the three infected groups on average (B) were counted at various times during the post-immersion challenge. Three infected groups with different concentration filters (1:100, 1:200, and 1:400) of tissue homogenates were indicated, respectively. The control group was immersed in phosphate-buffered saline (n = 200). Virus infections from dead larvae in the tested groups (at days 3, 7, and 15) or the control group (at days 0 and 19) were confirmed by RT-PCR (C): M, DNA ladder; 1, Chirocephalus; 2, zero-day in control group; 3–5, seven-day for three infected groups; 6–8, fifteen-day for three infected groups; 9, control group at day 19; N, negative control; P, positive control.

