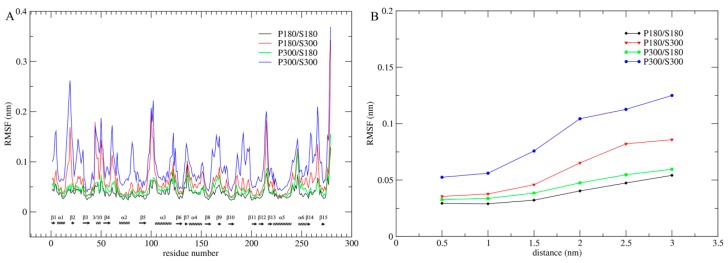
Figure 1.
Flexibility profiles of proteinase K calculated from the joined trajectories at the four combined temperatures. (A) Per-residue Cα RMSF profiles as a function of residue number. SSEs were marked along the horizontal axis with spirals and arrows representing α (or 3/10) helices and β strands, respectively; (B) Cα RMSF values as a function of distance from the protein core to the protein surface. In both (A) and (B), the black, red, green, and blue lines are profiles corresponding to the combined temperatures P180/S180, P180/S300, P300/S180, and P300/S300, respectively.

