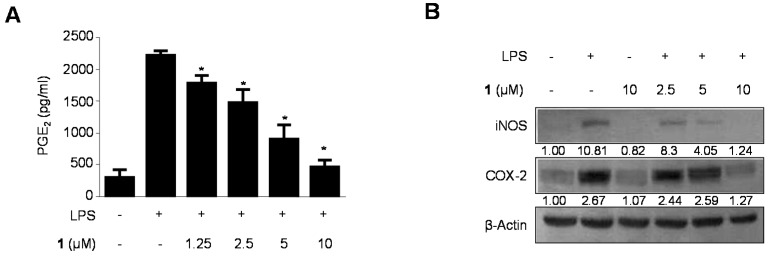
Figure 4.
(A) The effects of cudraflavanone D (1) on protein expression of iNOS and COX-2 (B) in BV2 microglial cells stimulated with LPS. Cells were pre-treated for 3 h with the indicated concentrations of cudraflavanone D (1) and then stimulated for 24 h with LPS (1 μg/mL). The concentrations of iNOS and COX-2 (B) were determined as described in Materials and Methods. Western blot analyses were performed as described in Materials and Methods and representative blots of three independent experiments are shown. Band intensity was quantified by densitometry and normalized to β-actin; the values are presented below each band. Relative data represent the mean values of three experiments ± SD. * p < 0.05, as compared to the cells treated with LPS only.

