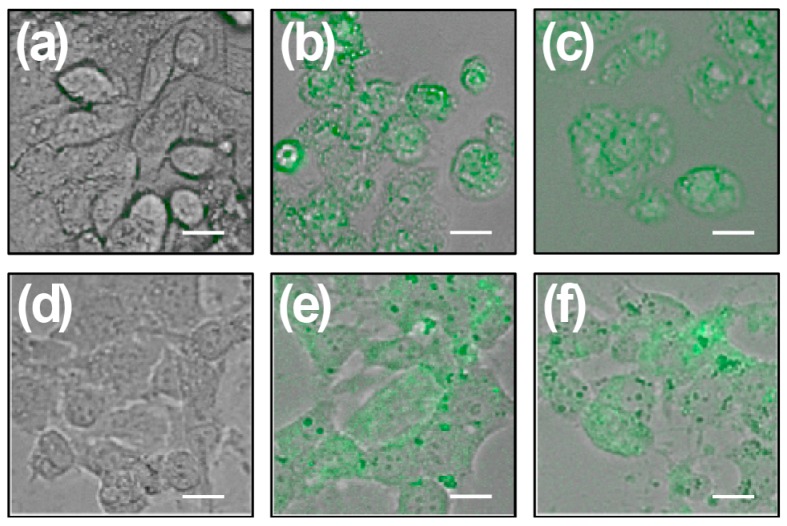
Figure 3.
HepG2 and HepM cells exposed to chalcones CH1 and CH2. HepG2 and HepM cells were grown for 24 h, and then treated with each chalcone, independently. Figures show representative phase-contrast images from at least three separates experiments of HepG2 (a–c) and HepM (d–f) exposed to vehicle (control) (a,d); 50 μM CH1 (green) (b,e); and 50 μM CH2 (green) (c,f). Bar scale represents 10 μm.

