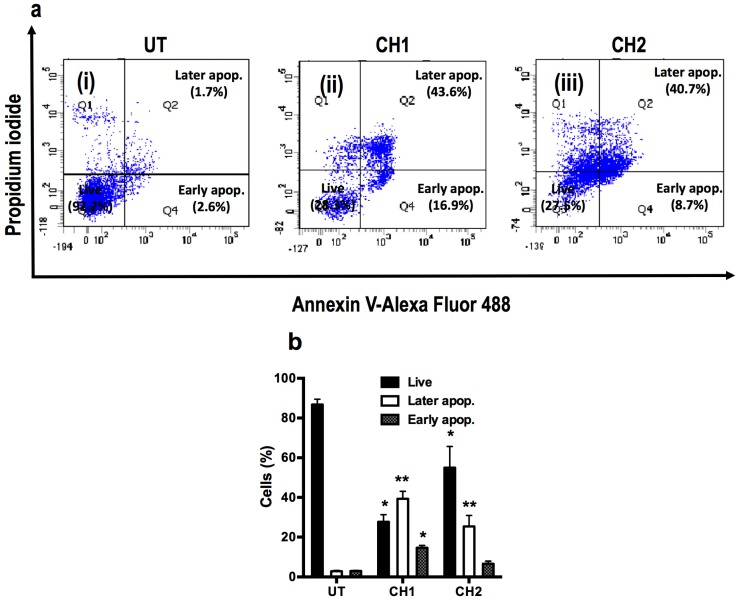
Figure 5.
Chalcone-induced apoptosis in HepG2 cells as assayed by flow cytometry. (a) HepG2 cells were treated with CH1 and CH2 (50 μM) for 24 h. The cells were then harvested and stained with Annexin V and PI and flow cytometric analysis was performed to analyze the apoptosis; (b) Summary of the apoptosis data in histogram form. Data are expressed as the mean ± standard error of the mean (SEM) from at least three independent experiments. * p < 0.05 vs. the untreated (UT) group; ** p < 0.01 vs. the untreated group.

