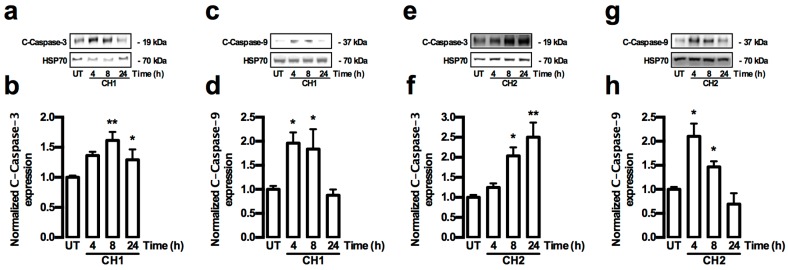
Figure 7.
Chalcones-induced caspase intrinsic pathway in HepG2 cells. (a–h) Cells were treated with CH1 and CH2 (50 μM, each) and protein expression was analyzed. (a,c,e,g) Representative images from Western blot experiments performed for the detection of C-caspase-9 and C-caspase-3; (b,d,f,h) Densitometric analyses of the experiments shown in (a,c,e,g), respectively. Protein levels were normalized against HSP70 and data are expressed relative to the UT (untreated) condition. Data are expressed as the mean ± standard error of the mean (SEM) from at least three independent experiments. Statistical differences were assessed by a one-way ANOVA (Kruskal–Wallis) followed by Dunn’s post hoc test. * p < 0.05; ** p < 0.01 vs. UT group.

