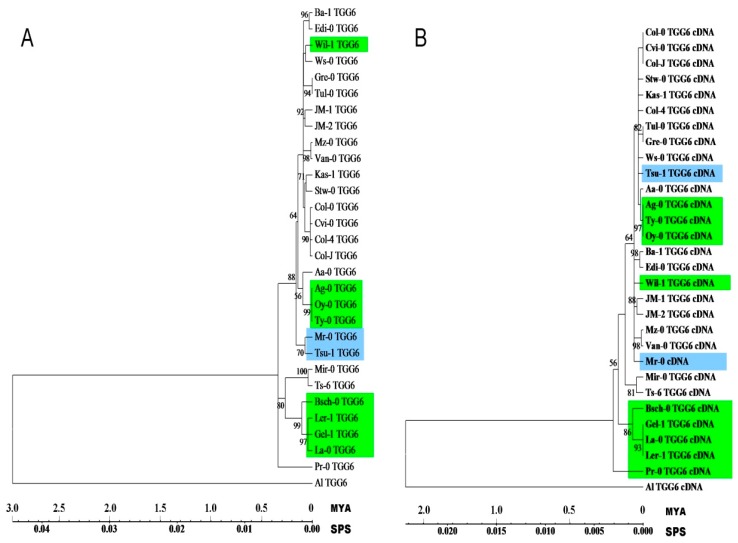
Figure 3.
Phylogenetic analysis of AtTGG6 genomic (A) and cDNA (B) sequences by Maximum Likelihood method. The evolutionary history was inferred based on the Tamura–Nei model [23]. The bootstrap values over 50% are shown next to the branches. Initial tree(s) for the heuristic search were obtained automatically. The tree is drawn to scale, with branch lengths measured in million years (MYA) and substitutions per site (SPS). Evolutionary analyses were conducted in MEGA6 [24]. Functional alleles are highlighted in green or blue. The two functional alleles in Tsu-1 and Mr-0 which are clustered different in genomic and cDNA phylogenies are highlighted in blue.

