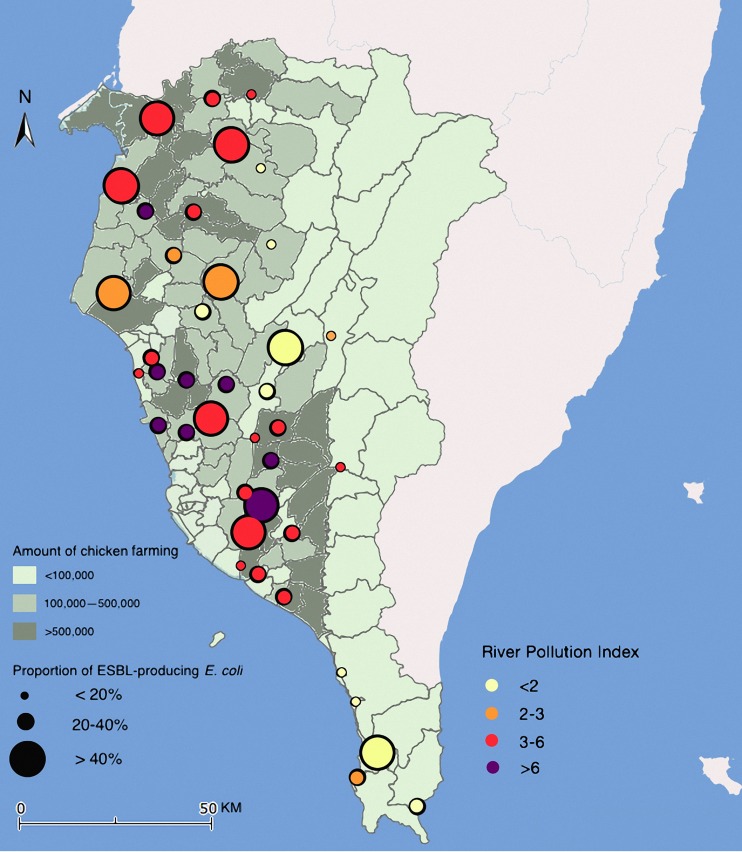
FIG 4.
Geographic distribution of the proportion of ESBL-producing E. coli in relation to the number of chickens being raised and river pollution index (RPI) in southern Taiwan. The background of the map with the color gradient presents the number of chickens raised in each county; the dots with a size display the proportion of ESBL-producing E. coli in each sampling point, and the color of the dots represents the RPI. Map created via Paint 2, version 5.3.1 (250) (TryBest Studio), using data from the Taiwan National Land Surveying and Mapping Center.

