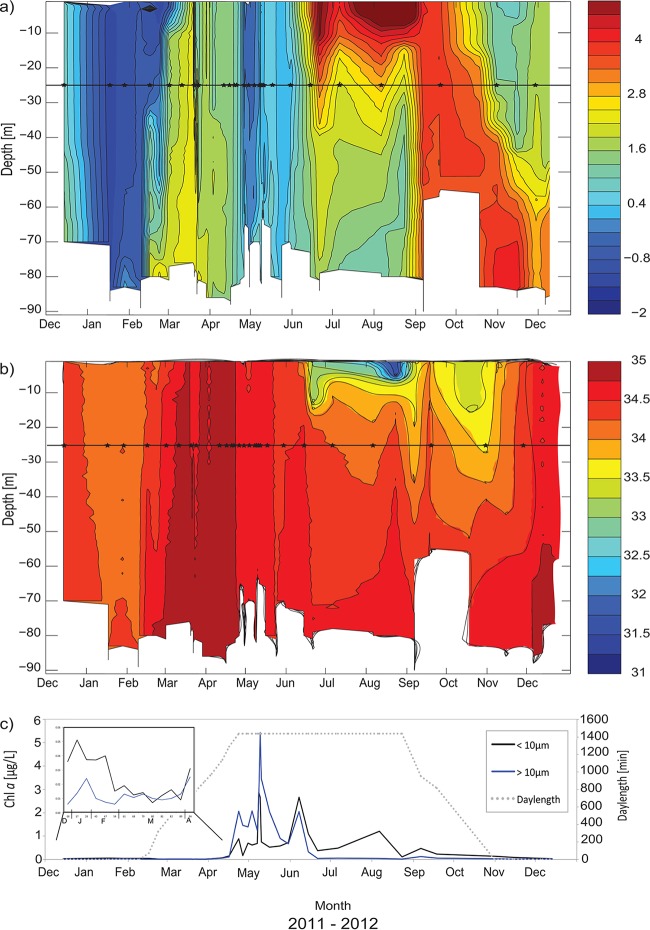
FIG 2.
Development of the water column at the IsA station from December 2011 to December 2012. (a and b) Hovmøller diagrams of seawater temperature (in degrees Celsius) (a) and salinity (b) based on CTD measurements. The horizontal line in each diagram indicates a sampling depth of 25 m, and the stars along the line mark the sampling dates. (c) Day length (provided by www.solartopo.com/daylength.so) and measured chlorophyll a (Chl a) concentrations in two size fractions (smaller than 10 μm and larger than 10 μm; measurements are from the 25-m sampling depth). (Inset) Enlargement of the period from the end of 2011 until mid-April 2012. Fractionated (>10 μm and 10 to 0.7 μm) and total Chl a concentrations at IsA at the 25-m depth are given in Table S4 in the supplemental material.

