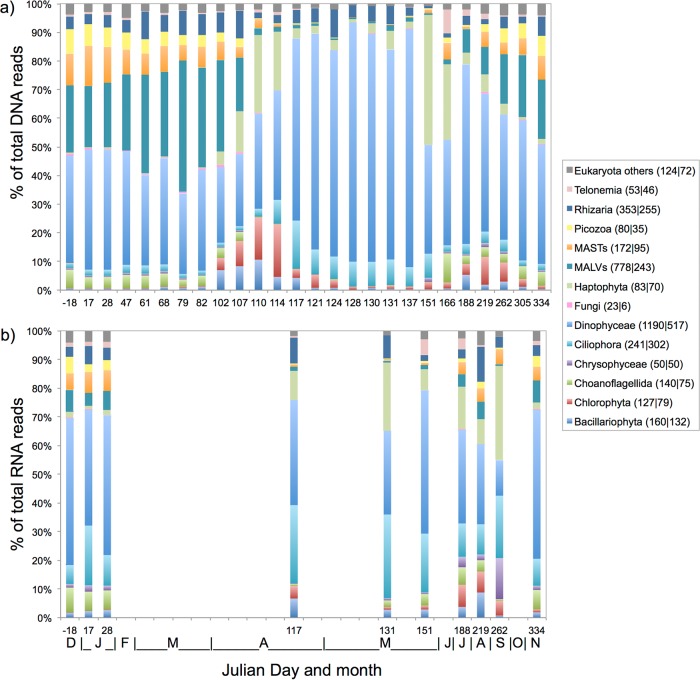
FIG 3.
Relative OTU read abundances of dominant taxonomic groups within the DNA (a) and RNA (b) libraries from December 2011 (Julian day −18) to November 2012 (Julian day 334). Months are indicated by the first letters of their names at the bottom of panel b. OTUs that did not belong to any of the groups listed or that had <100 reads in every sample were grouped in the “Eukaryota others” category. The numbers of OTUs assigned to each taxonomic group are given in parentheses in the key (DNA|RNA).

