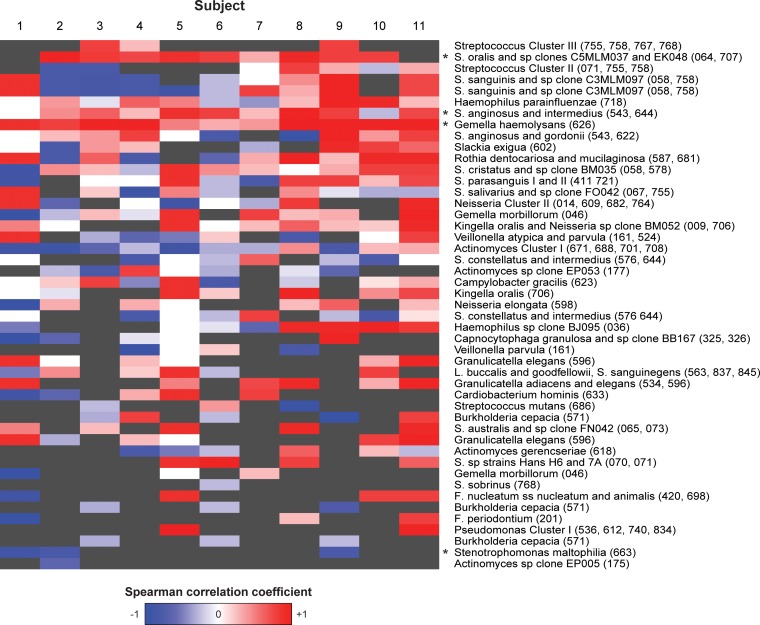
FIG 3.
Heat map showing changes in bacterial intensities in the early biofilm over time. Shown are the results for the 47 probes with the highest level of abundance (maximum HOMIM score of >2 across all samples). Each column represents one subject, and each cell indicates Spearman's correlation coefficient (rho) of the HOMIM scores for a given species in a given subject with the four time points of biofilm formation. Red and blue represents rho values of +1 and −1, respectively, indicating that the proportion of a given species continuously increased or decreased, respectively. White represents a rho value of 0, indicating that the scores showed no pattern of increase or decrease over time. Gray indicates that all HOMIM scores for a given species in a given subject were identical and rho is undefined. All of the available time points for each subject (3 or 4) were used to compute the correlation coefficient within that subject. The probes are labeled with species descriptors, followed by HOMD oral taxa in parentheses. F., Fusobacterium; L., Leptotrichia; S. sanguinegens; Sneathia sanguinegens; all other S., Streptococcus. Spearman's correlation coefficients were also computed for each species with respect to time points across all samples in each row, and probes with across-subject rho values significantly different from zero (P < 0.05) are indicated by asterisks.

