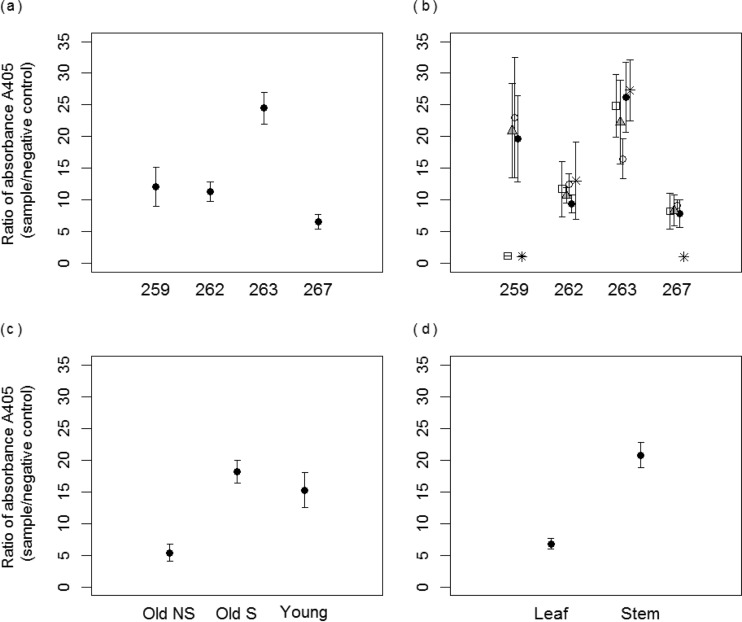
FIG 1.
Ratio of absorbances (A405 sample/A405 negative control) obtained in ELISA for tested samples from Panicum virgatum plants. (a) Per-plant averages derived from 26 tissue samples per plant. (b) Per-tiller averages for each plant, derived for four mature green tillers (six tissue samples each) and one young tiller (two tissue samples). Empty circles, black circles, gray triangles, asterisks, and empty squares represent five different stems in each plant. (c) Averages per tiller class. Old NS (48 samples), mature green tiller with no symptoms of virus infection; Old S (48 samples), mature green tiller with symptoms; Young (8 samples), younger green tiller (all nonsymptomatic). (d) Averages derived for leaves (52 samples total) and stem portions of tillers (52 samples total). Error bars represent ±1 standard error of the means.

