Figure 2.

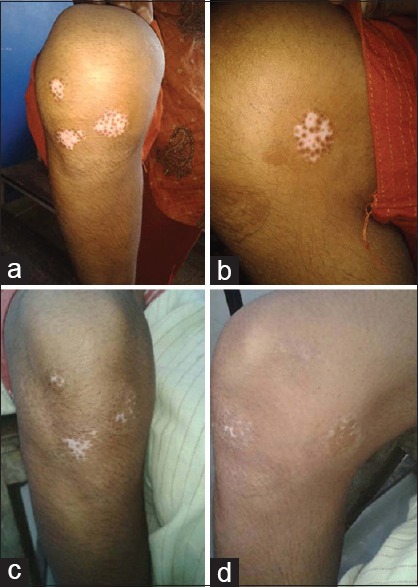
Before treatment (BT) and after treatment (AT) of both Groups (a) Group A – BT, (b) Group A – BT, (c) Group A – AT, (d) Group A – AT

Before treatment (BT) and after treatment (AT) of both Groups (a) Group A – BT, (b) Group A – BT, (c) Group A – AT, (d) Group A – AT