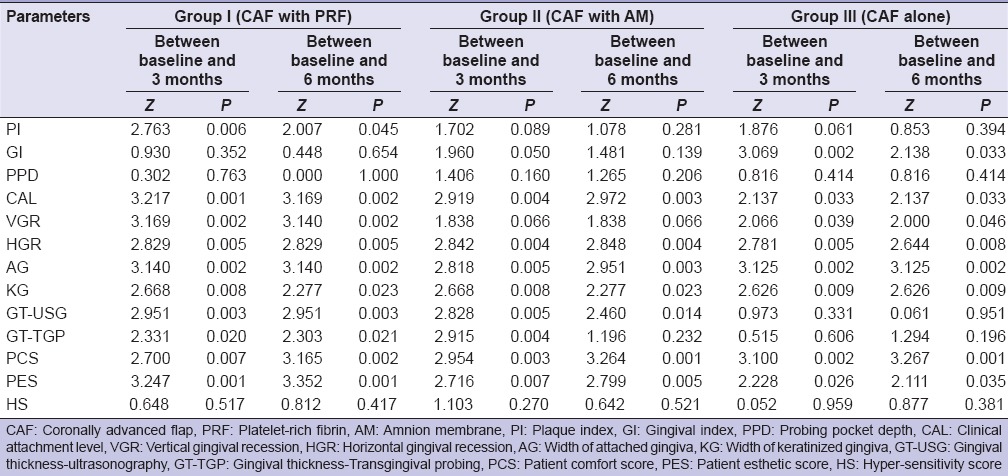
Table 3.
Intragroup comparison for mean change in various parameters for Group I (CAF with PRF), Group II (CAF with AM) and Group III (CAF alone) at baseline, 3 months and 6 months (Wilcoxon signed-rank test)

Intragroup comparison for mean change in various parameters for Group I (CAF with PRF), Group II (CAF with AM) and Group III (CAF alone) at baseline, 3 months and 6 months (Wilcoxon signed-rank test)
