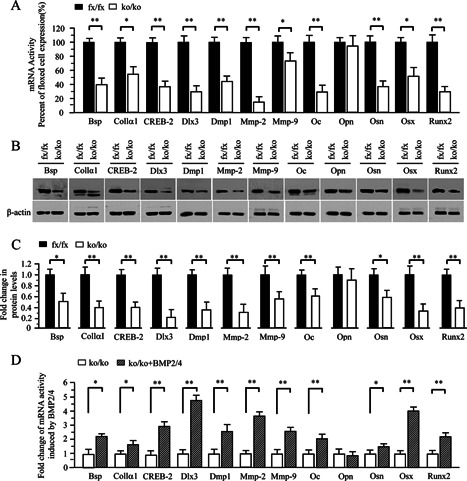
Figure 4.

Altered expression of bone‐related and processing protein genes in the iBMP2/4 knock‐out osteoblastic cells. (A) Total RNA was isolated from the iBMP2/4fx/fx and iBMP2/4ko/ko ob cells for measuring transcripts of Bsp, Collα1, CREB‐2, Dlx3, Dmp1, Mmp‐2, Mmp‐9, Oc, Opn, Osn, Osx, and Runx2 genes by qRT‐PCR. Cyclophilin A was used as an internal control. Expression of these mRNAs in the BMP2/4fx/fx cells acts as a 1.0‐fold increase. The bar graphs show mean ± S.D. from three independent experiments with triplicate for each transcript measurement. *P < 0.05, **P < 0.01. (B) The iBMP2/4fx/fx and iBMP2/4ko/ko ob cells were lysed and protein expressional levels were detected by Western blot assay using antibodies specific to Bsp, Collα1, CREB‐2, Dlx3, Dmp1, Mmp‐2, Mmp‐9, Oc, Opn, Osn, Osx, and Runx2, respectively. β‐actin was used as an internal control. (C) The protein band intensity was quantitated by ImageJ software. The proteins from the iBMP2/4fx/fx ob cells were normalized to β‐actin protein as control. The fold change in the BMP2/4ko/ko cell protein expression levels was calculated by dividing the iBMP2/4fx/fx ob protein expression levels. The bar graphs show mean ± S.D. (n = 3). This result demonstrates that several protein expression levels were decreased in the iBMP2/4ko/ko ob cells. (D) The iBMP2/4ko/ko ob cells were treated with or without the recombinant BMP2/4 for 48 h and total RNA was isolated for measuring transcripts of Bsp, Collα1, CREB‐2, Dlx3, Dmp1, Mmp‐2, Mmp‐9, Oc, Opn, Osn, Osx, and Runx2 genes by qRT‐PCR. Cyclophilin A was used as an internal control. Expression of these mRNAs in the BMP2/4ko/ko cells acts as a 1.0‐fold increase. The bar graphs show mean ± S.D. (n = 3). Asterisks indicate *P < 0.05, ** P < 0.01. fx, floxed; ko, BMP2/4 knock‐out.
