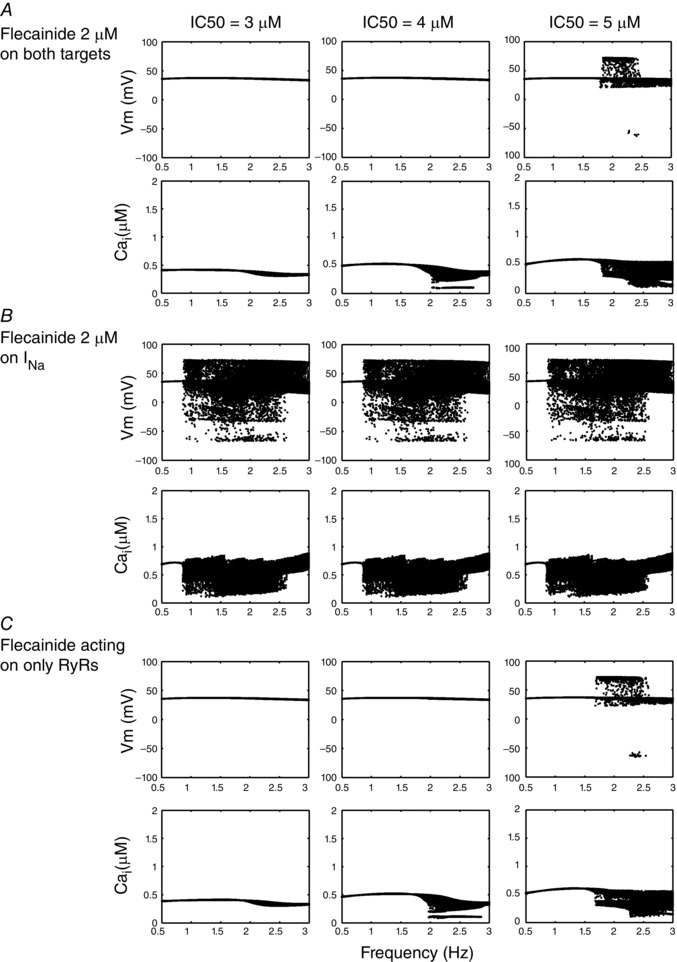
Figure 1. Testing IC50 of flecainide in the cell model for INa, RyR2 and both targets in combination .

Voltage dynamics is shown for each IC50 case, and the voltage and Ca2+ transient maxima are binned for each pacing frequency between 0.5 and 3 Hz during the second half of a 2 min simulation time course. A, CASQ2(−/−) myocytes with 3, 4 and 5 μM IC50 effects on both Na+ channels and RyRs. B, flecainide interaction with just Na+ channels. C, flecainide concentrations acting on only RyRs.
